
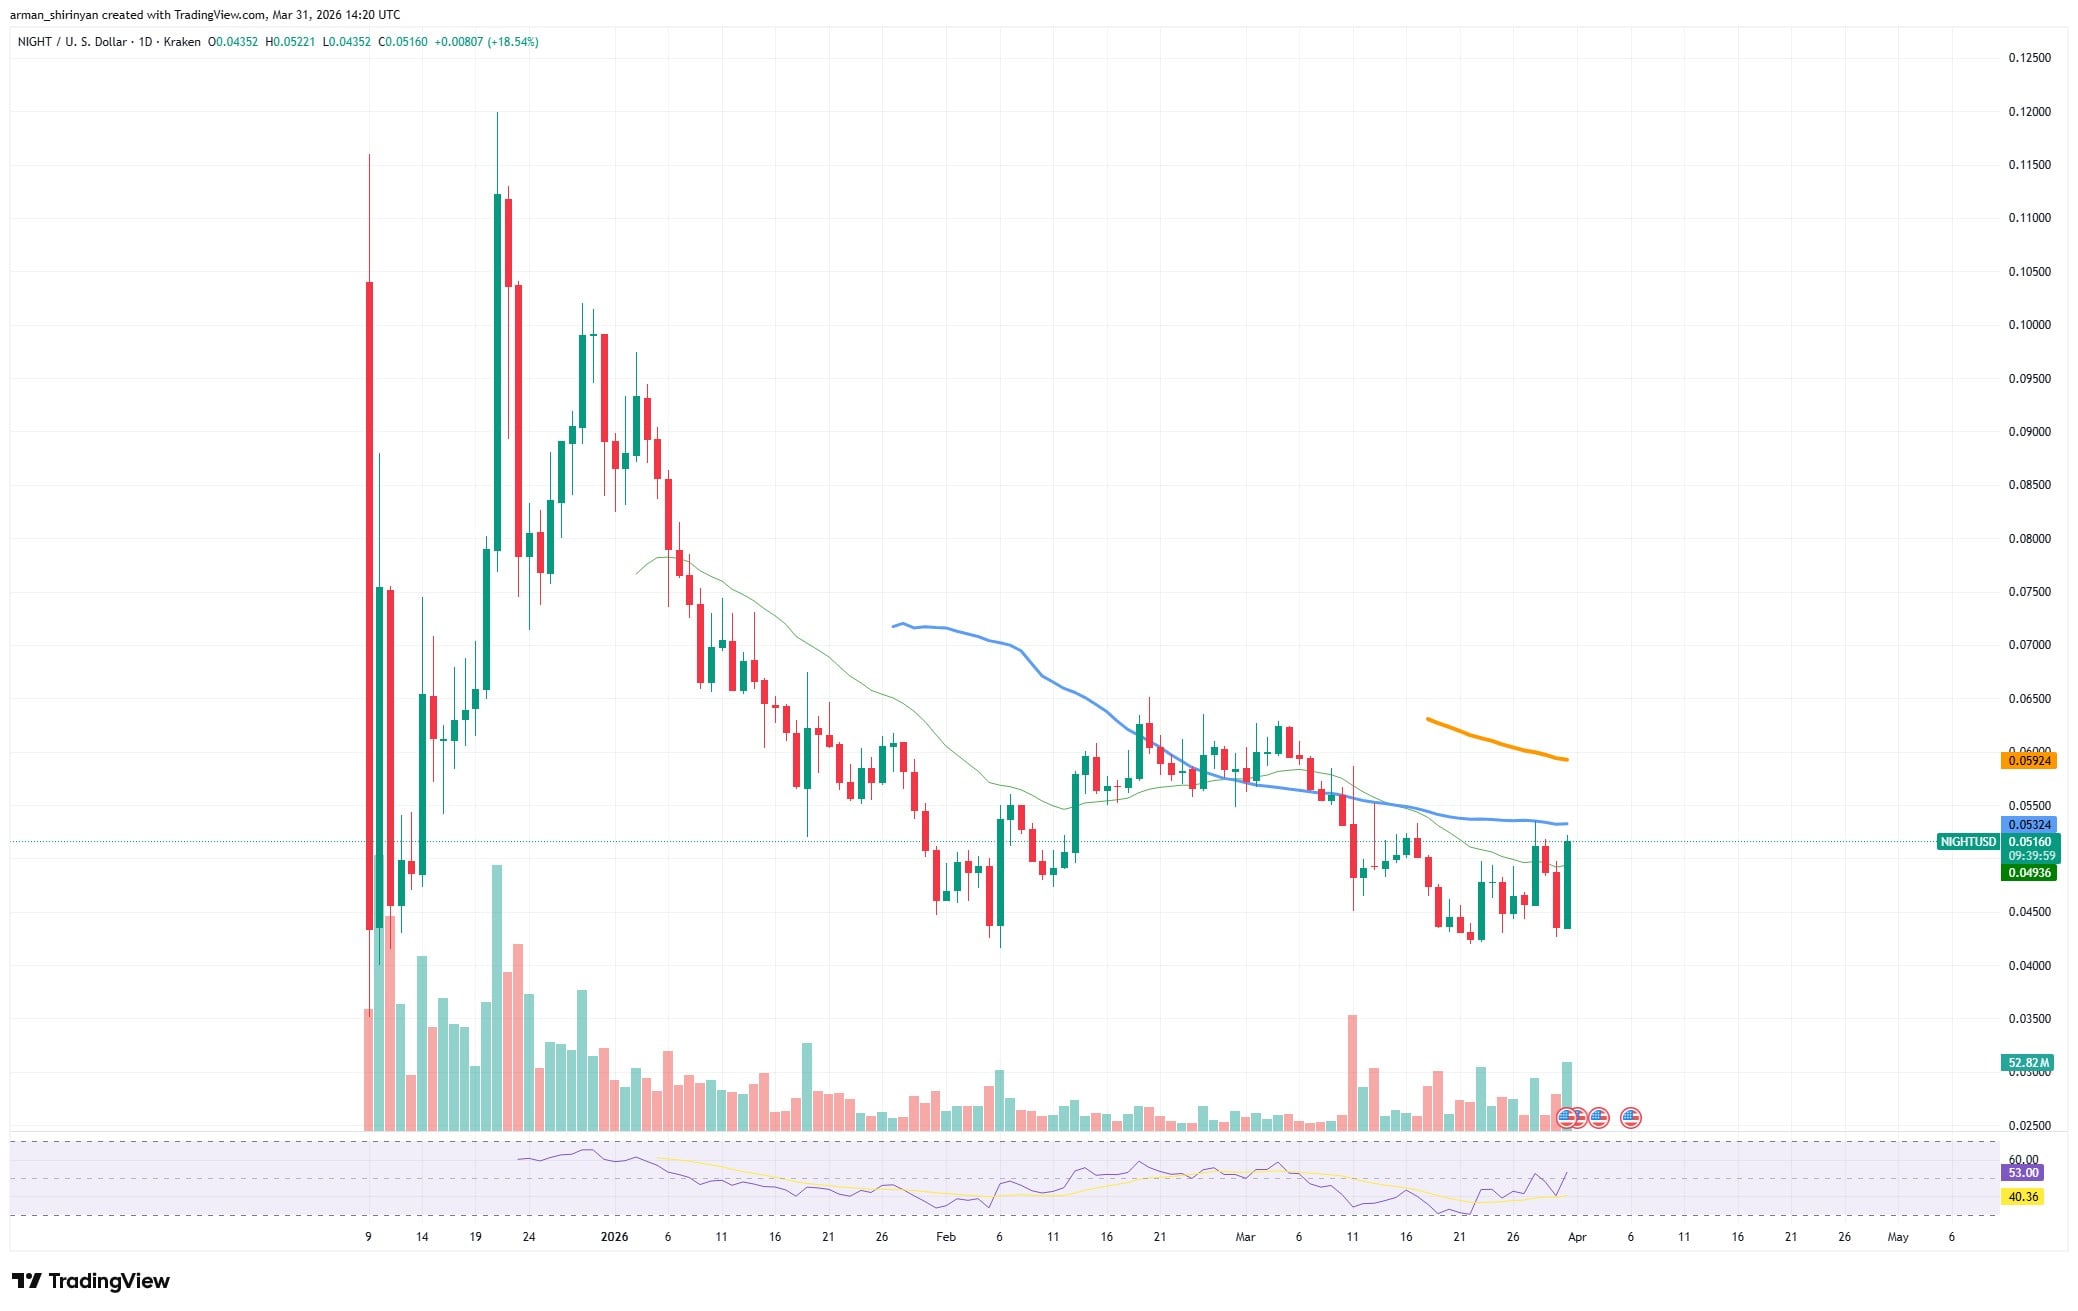
Since its initial explosive debut, Midnight is about to undergo its first significant technical test. The context is crucial because the asset is now in stabilization rather than price discovery. The price has since cooled off considerably and retraced into the $0.04-$0.05 zone, following a strong launch-driven rally that propelled $NIGHT toward the $0.10-$0.11 range.
We are currently witnessing a shift from expansion driven by hype to a more structured market phase. Candles have tightened, volatility has decreased and the asset is starting to respect horizontal levels and moving averages.
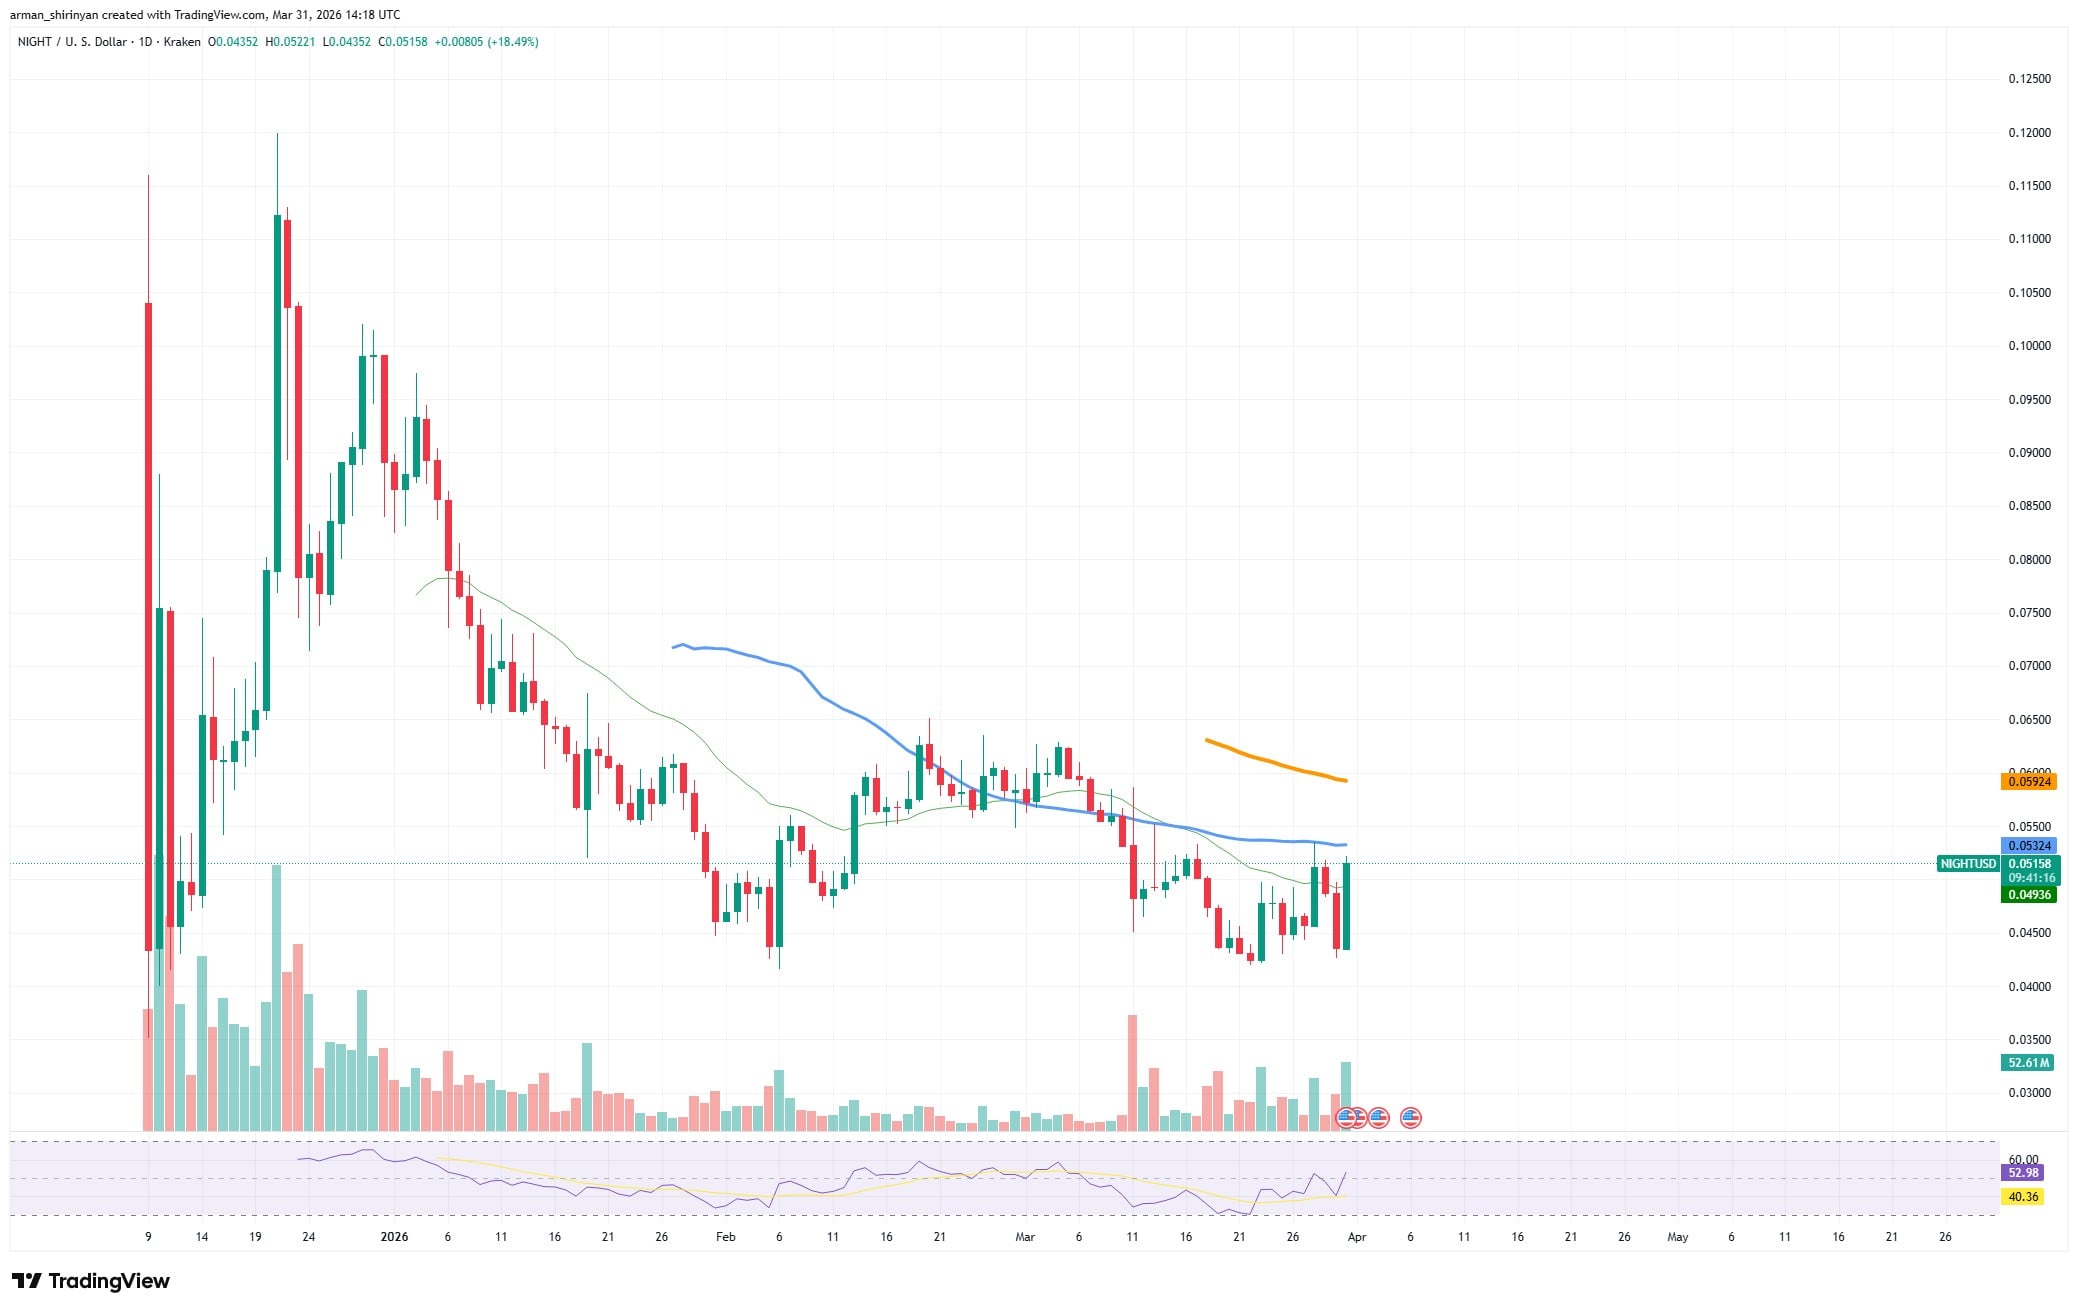
$NIGHT is currently pushing into its first significant resistance cluster, which is located between $0.053 and $0.055. This zone is a technically significant barrier because it coincides with previous rejection levels and short-term moving averages.
Buyers are still there, as evidenced by the recent bounce, but it is unclear if they have enough strength to take back control, or whether this is just another lower high in an impending downtrend. Volume conveys conflicting information. As is common following a launch spike, the initial spike in participation has significantly decreased.
Midnight not suffocating Cardano
As of right now, its influence on the Cardano ecosystem is minimal. Although the narrative presents Midnight as a privacy-focused extension or complementary layer within the Cardano network, there is not any concrete proof that it is currently significantly altering Cardano’s larger market dynamics — at least not based on price or on-chain activity.
Early-stage tokens seldom have an instantaneous impact on the entire ecosystem, unless they are consistently adopted and useful. Instead of acting as a catalyst for Cardano, Midnight is currently acting more like a stand-alone speculative asset. Investors can easily understand this stage.
A recovery toward higher levels is possible if $NIGHT breaks and holds above the $0.055-$0.06 resistance — with increasing volume. A return to consolidation, or even a lower range, is likely if it fails here as the structure is still weak.
Shiba Inu's volatility moving forward
Shiba Inu is subtly preparing for an increase in volatility, which could result in a short-term squeeze of about 16%. However, the context of the move is more important than the actual number.
For months, $SHIB has been in a distinct downtrend, characterized by steadily declining highs and ongoing pressure from declining moving averages. The price action has been structurally weak. The 50-day and 100-day averages, which continue to serve as dynamic resistance, are among the important trend indicators that the asset is still trading below. Despite recent stabilization, this maintains the overall bias: pessimism.
But the compression has altered. In recent weeks, $SHIB has developed a tightening structure with rising local support, as evidenced by higher lows, while upside attempts are frequently capped. This results in a traditional squeeze setup: a market that is essentially coiling, decreasing volatility and a narrowing price range.
Technically speaking, a move toward the $0.0000068-$0.0000070 region — which roughly corresponds with that 16% upside projection — is made possible by a breakout above the immediate resistance zone surrounding recent highs. Additionally, this region aligns with the subsequent resistance cluster created by earlier moving averages and consolidation zones.
Indicators of momentum show this shift. Selling pressure appears to be waning, but it is still present, as the RSI is gradually returning from oversold territory and heading toward neutral. The idea that the current structure is preparatory rather than impulsive is reinforced by the comparatively low volume.
Participation is necessary for a squeeze. This arrangement can just as easily resolve to the downside, maintaining the dominant trend in the absence of a significant increase in inflows or wider market support. Because of the fragility of the ascending support line, a breakdown below it would invalidate the compression thesis and probably cause $SHIB to return to its lower range.
Ethereum faces negative signs
Although it might not have the same significance as a full 50/200-day crossover, Ethereum is getting close to what could be called a mini-death cross, and the implications are still negative, given the state of the market.
The shorter-term averages (probably the 20 and 50 EMA) are rolling over and converging downward on the chart, while $ETH is still stuck below its important moving averages. Short-term momentum is being weakened by this compression and downward alignment.
The location of the crossover is just as problematic as the crossover itself. Ethereum continues to trade significantly below its declining 100 and 200-day moving averages. This increases the significance of any bearish crossover in the short-term structure since it takes place within a larger downtrend.
$ETH recently made an attempt at a comeback but was unable to maintain momentum above local resistance, creating a lower high. Though it is comparatively shallow and vulnerable, the current structure exhibits a rising support trendline from recent lows. The mini-death cross might serve as confirmation rather than merely a warning if that support breaks, paving the way for a retest of the $1,800-$1,900 range.
Strong accumulation is not indicated by volume either. The lack of conviction in the recovery effort suggests that buyers are still cautious and primarily reactive rather than proactive.
However, this is not a scenario where a breakdown is certain. The mini-death cross will turn into a failed signal if Ethereum is able to recover the short-term moving averages and turn them back into support. This setup has the potential to spur upside through short covering.