
After recovering from the steep decline that momentarily pushed the market toward the $63,000 zone, the price of Bitcoin is pushing toward the $70,000 region, marking one of its most significant technical moments in recent weeks. Buyers swiftly intervened and pushed the asset back into a higher consolidation range, resulting in a quick recovery. Unfortunately, $XRP and $SHIB are yet to follow their big brother.
Bitcoin's position gets better
The market is now in a position where a breakout attempt seems more likely because Bitcoin is already above the psychological $70,000 threshold. The recovery structure has been progressively evolving. Bitcoin started printing higher lows while compressing within a tightening triangular pattern after creating a local bottom around $63,000.
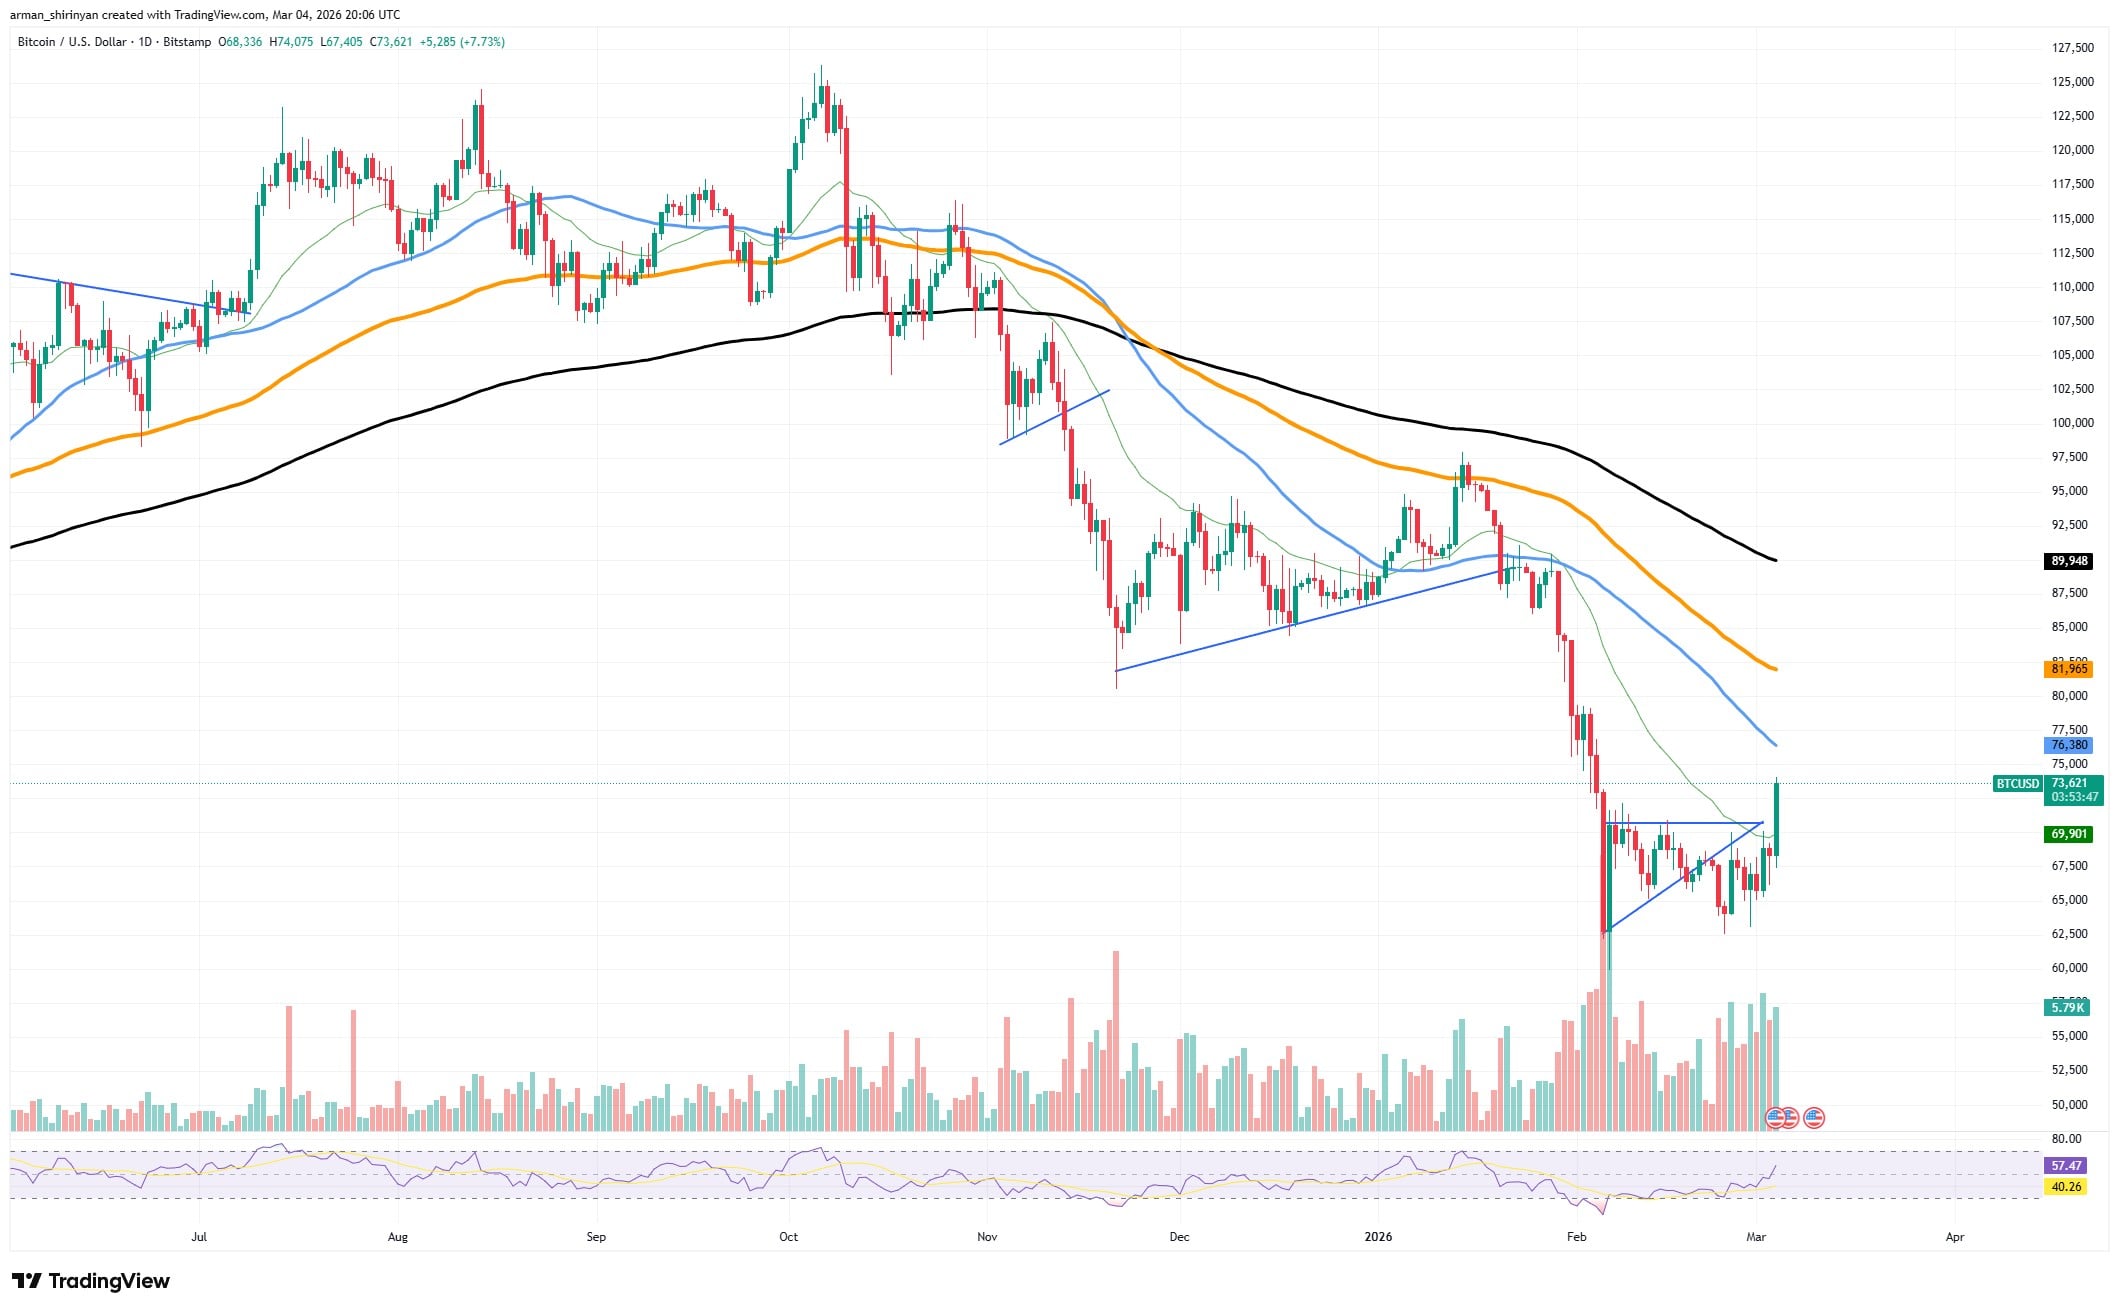
As sellers gradually lose momentum and the price approaches resistance, this kind of structure frequently indicates increasing buying pressure. Additionally, volume has increased during the recovery phase, indicating that actual market participation rather than a feeble technical bounce is driving the rebound.
Bitcoin is currently trading close to $72,000 and has momentarily surpassed $71,000. Nevertheless, a breakout is not always confirmed by rising above a resistance level. When traders start taking profits after a quick recovery, the price can frequently briefly rise above these thresholds before reversing.
When momentum traders and sidelined capital return to the market, Bitcoin may accelerate toward higher resistance zones if it manages to stabilize above $70,000. However, if this level is not maintained, there may be another period of consolidation or even a decline to the mid-$60,000 range.
$XRP's technical pause
As the asset compresses between the 26-day exponential moving average and a rising support trendline, $XRP is about to enter a pivotal technical phase.
Following a protracted decline that caused the price to drop from the multi-dollar area to the $1.30-$1.40 range, $XRP has now started to form a tighter consolidation structure. Even though the market has been comparatively quiet in recent sessions, the way prices are currently forming indicates that this calm period might not last very long.
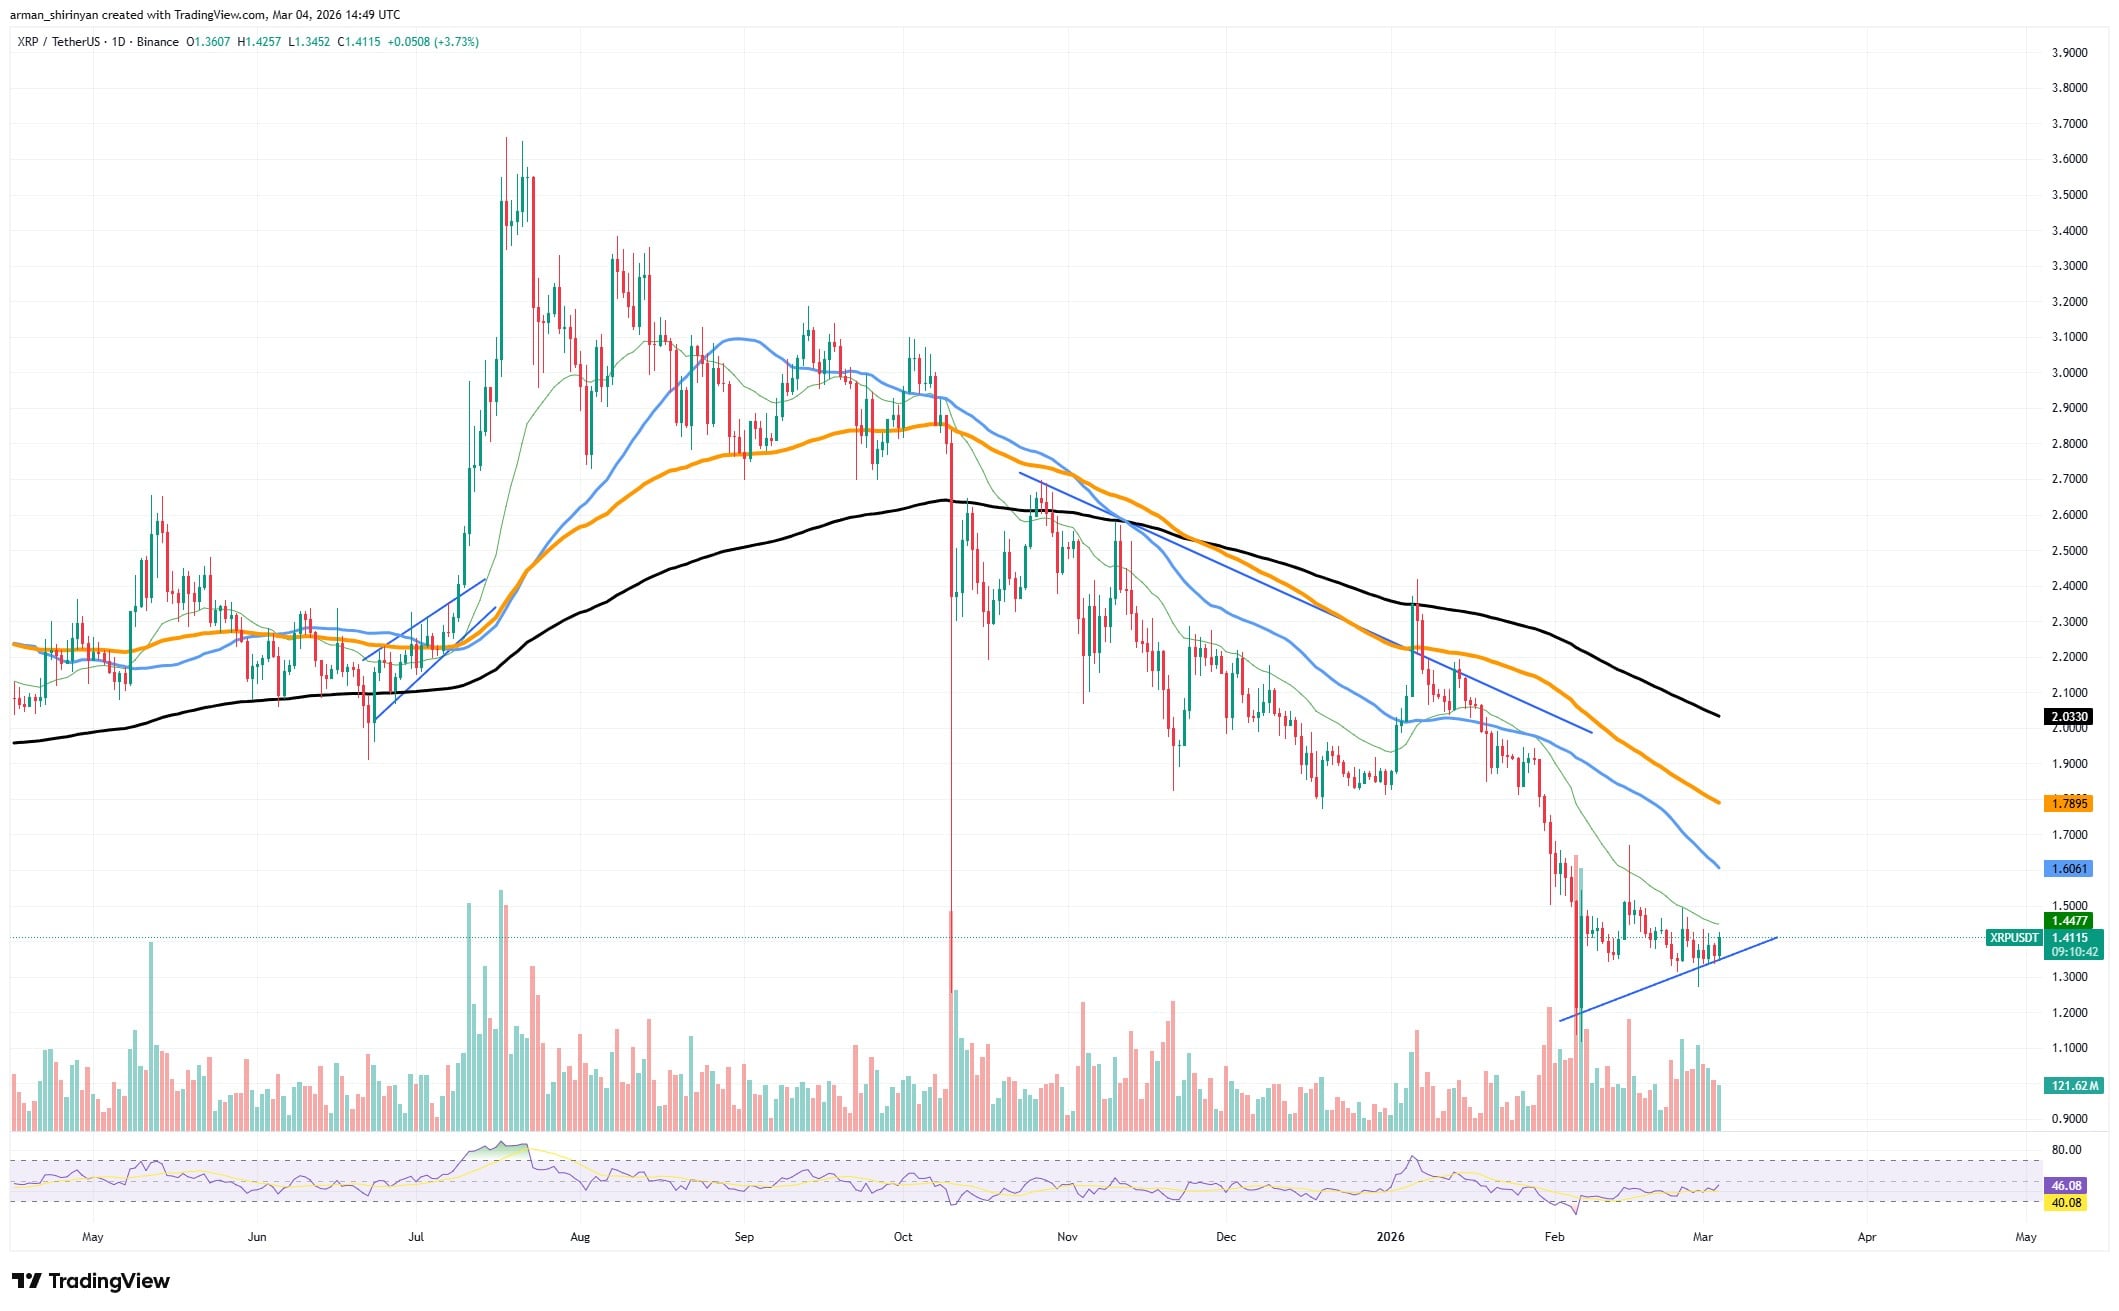
After recovering from a steep decline that momentarily pushed the asset toward the $1.25 level, $XRP is currently trading around the mid-$1.30 zone. Buyers responded strongly to that move, resulting in a string of higher lows that now clearly form an ascending support line.
A short-term recovery toward higher resistance levels around $1.45, and possibly the $1.60 region, where a number of moving averages and prior price clusters are located, would probably be triggered by an upside breakout. But $XRP would be vulnerable to another leg lower if it broke below the rising support, potentially returning to the recent lows set earlier in February.
The possibility of an unanticipated volatility spike is what makes the situation especially intriguing. At best, sentiment regarding $XRP has remained neutral, and the market has been comparatively quiet. However, when pressure eventually releases, technical squeezes like the one that is currently developing frequently result in abrupt price movements.
Shiba Inu tumbles down
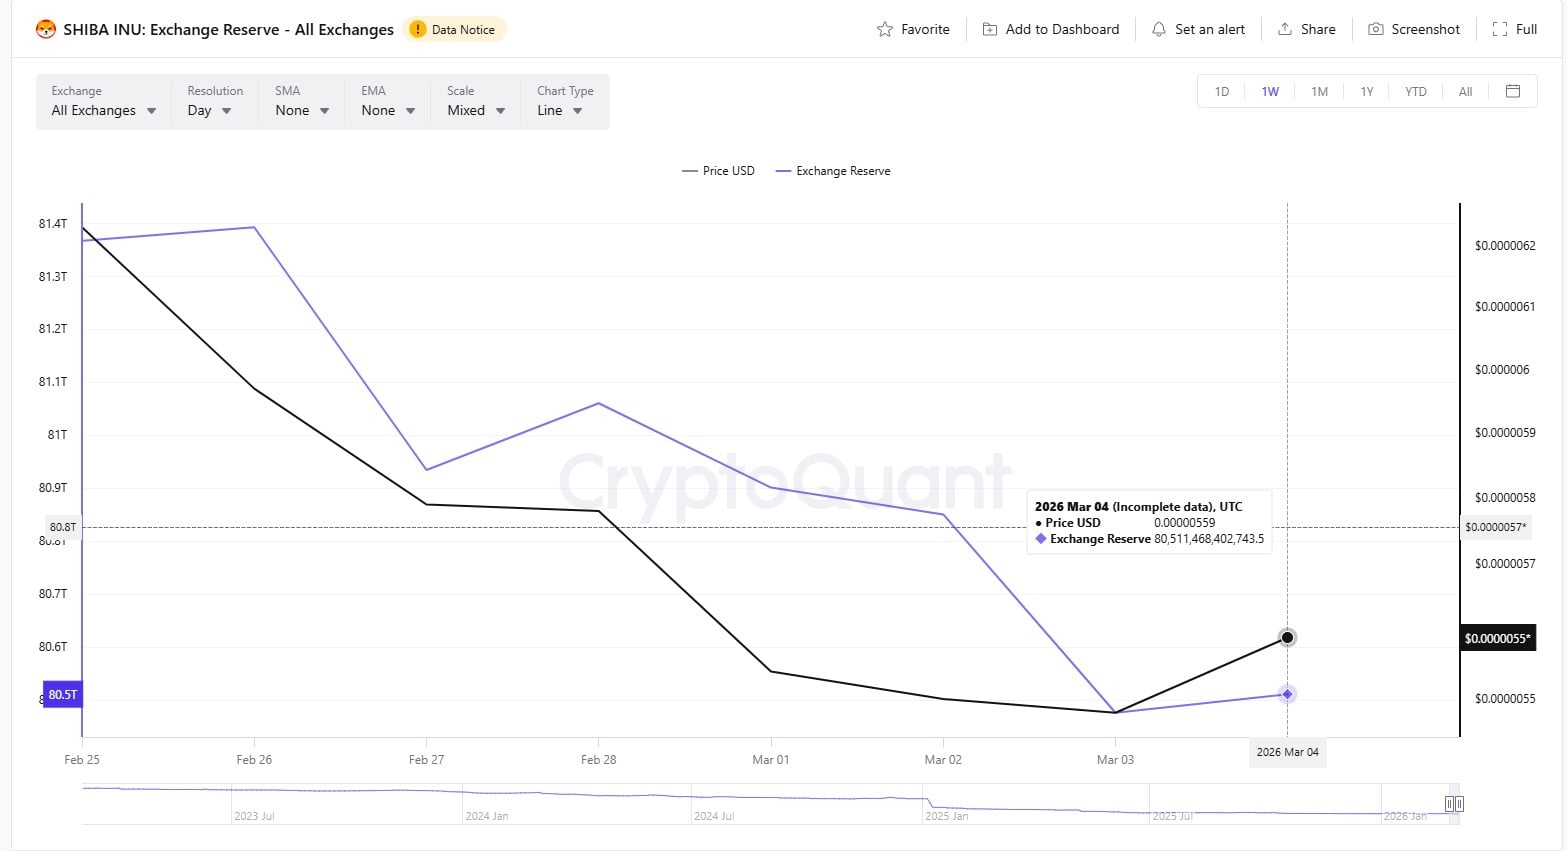
Shiba Inu is falling toward levels not seen since late 2023, as a result of ongoing selling pressure. $SHIB is currently trading close to the $0.0000055 region after months of steady decline.
It is below the majority of its important moving averages and exhibits little immediate momentum for a long-term recovery. The market is getting close to price ranges where a possible bottom might finally start to form, but the chart’s overall structure still clearly shows a bearish trend.
$SHIB has been going through a number of descending consolidation patterns technically. Over the past few months, every short-term triangle or wedge that emerged eventually resolved to the downside, strengthening the general downward trend. The price was driven toward the current support zone, which is now the asset’s most crucial region, by the most recent breakdown from a small triangular structure.
Around $0.0000050 is the first potential bottoming region. This level is near the point where the current downward momentum may start to wane and serves as a psychological support area. Before attempting a short-term recovery, $SHIB may form a stabilization range if buyers intervene.
Potential bottom zone
Between $0.0000045 and $0.0000048, there might be a more convincing bottom zone. Longer-term buyers seeking discounted entries may be drawn to this area, since it is consistent with past market cycles’ trading activity. The likelihood of a sustained reversal would be greatly increased if $SHIB reached this range and started to form higher lows.
The last and strongest possible support is located close to $0.0000040. A deeper capitulation scenario, where weak hands leave the market, would be represented by a move toward this level.
These circumstances frequently lay the groundwork for long-term reversals, particularly when they are combined with rising volume and increased accumulation.
With few bullish catalysts, $SHIB is currently stuck in a downward trend. The market will probably continue to be cautious until the price settles in one of these important support zones and starts to form higher highs.