$XRP must defend a multi-year ascending support trendline to maintain a bullish stance and keep the $8 hope alive.
$XRP has remained under strong selling pressure since the downtrend began in Q4 2025, falling more than 52% during this period. The price dropped 16.32% in February 2026, marking its fifth consecutive monthly loss for the first time since 2017, with a sixth straight decline possible if weakness continues.
However, chart data indicates that the downtrend is likely a normal correction within a broader bull market. At this point, $XRP must defend its long-standing ascending support trendline around $0.8 and break above a descending resistance trendline to revive momentum toward $8.
Key Points
- $XRP has fallen more than 52% since Q4 2025 and posted a 16.32% loss in February 2026, marking five straight monthly declines for the first time since 2017.
- Market data suggests that $XRP may be trading within a Wave C correction, following its Wave B peak at $3.66 in July 2025.
- This correction fits within a normal market pattern, and $XRP must defend its ascending support trendline to keep hopes of a recovery alive.
- A drop below the trendline and a weekly close below Fib. 0.786 at $0.6248 could expose $XRP to a deeper downside toward $0.3855 and $0.2087 to $0.0956.
- On the upside, $XRP must break resistance around a descending resistance trendline to push toward a minimum target of $8, and potentially $27.
$XRP Repeating a Familiar ABC Pattern
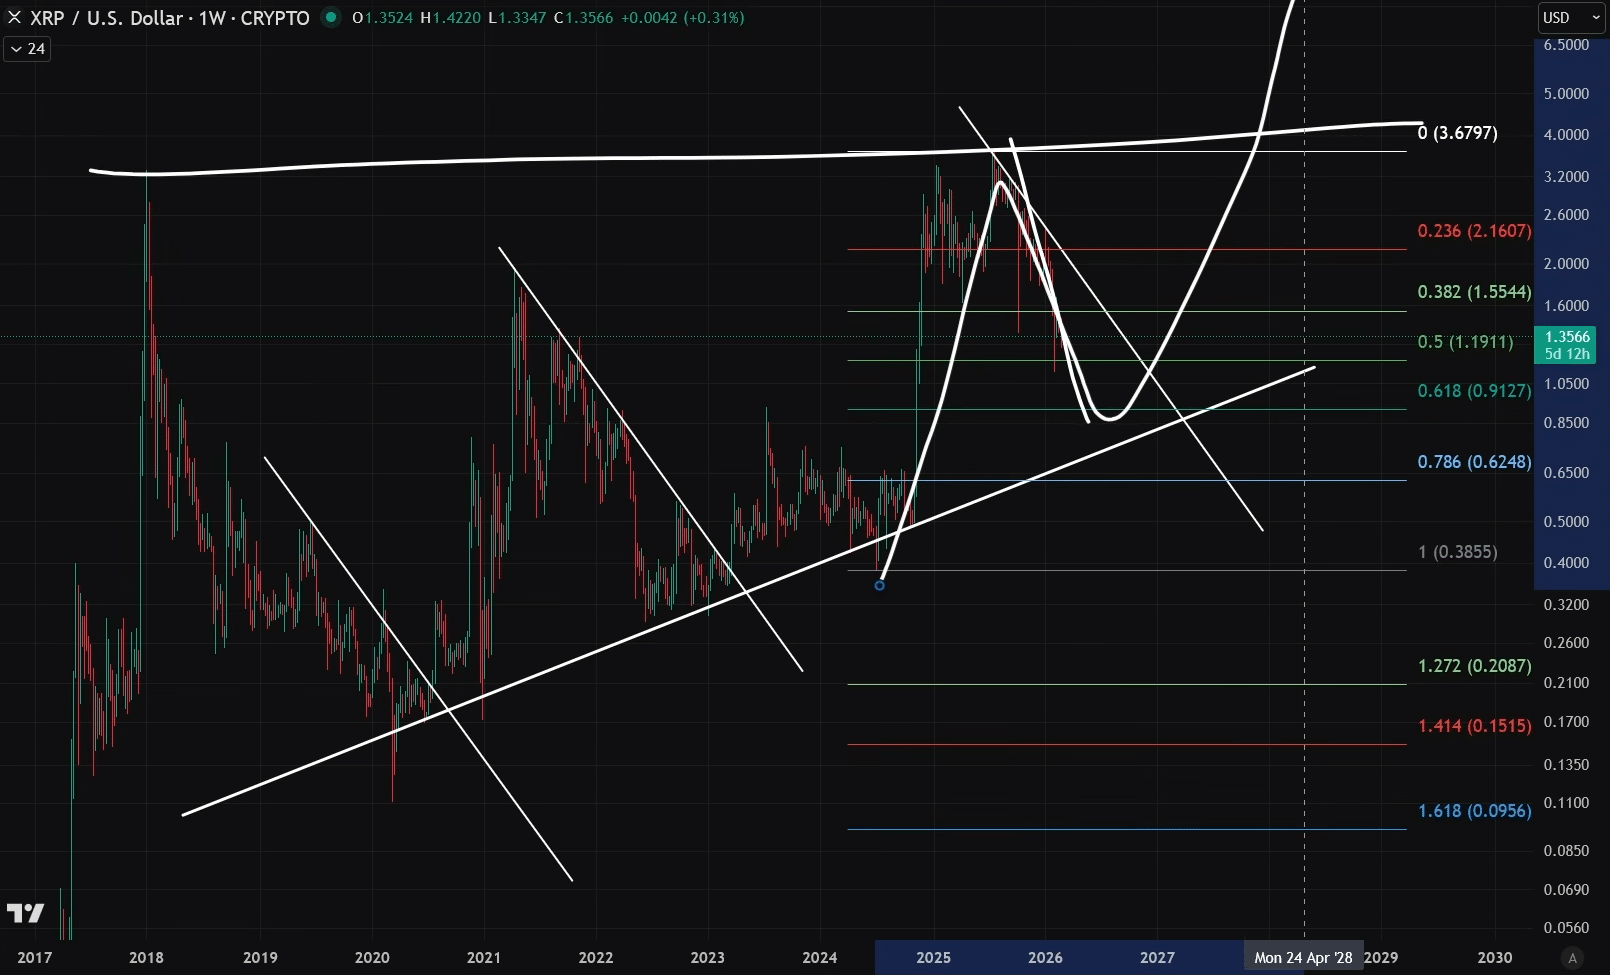
This is according to a recent analysis from market watcher CoinsKid. Notably, he called attention to $XRP on the weekly chart and pointed out similarities to the ABC correction that unfolded between 2021 and 2023.
Back then, $XRP climbed to $1.96 in April 2021 before dropping to $0.51 in July 2021, forming Wave A. It then bounced to $1.41 in September 2021 for Wave B, only to fall to $0.30 in January 2022 in Wave C.
The analyst believes a similar pattern may be forming now. Specifically, $XRP peaked at $3.4 in January 2025, then fell to $1.61 by April 2025 to complete Wave A. Wave B pushed prices higher again, reaching a new all-time high of $3.66 in July 2025. Since then, Wave C has taken over, dragging $XRP down to $1.35, and this phase may not be over yet.
The Ascending Trendline Around $0.85 Is Crucial
Interestingly, CoinsKid mentioned an important ascending support trendline that has guided $XRP since 2018 as the key focus of his analysis. Right now, that support sits near $0.85, and the market watcher argues that $XRP must defend this area to keep the bullish case intact.
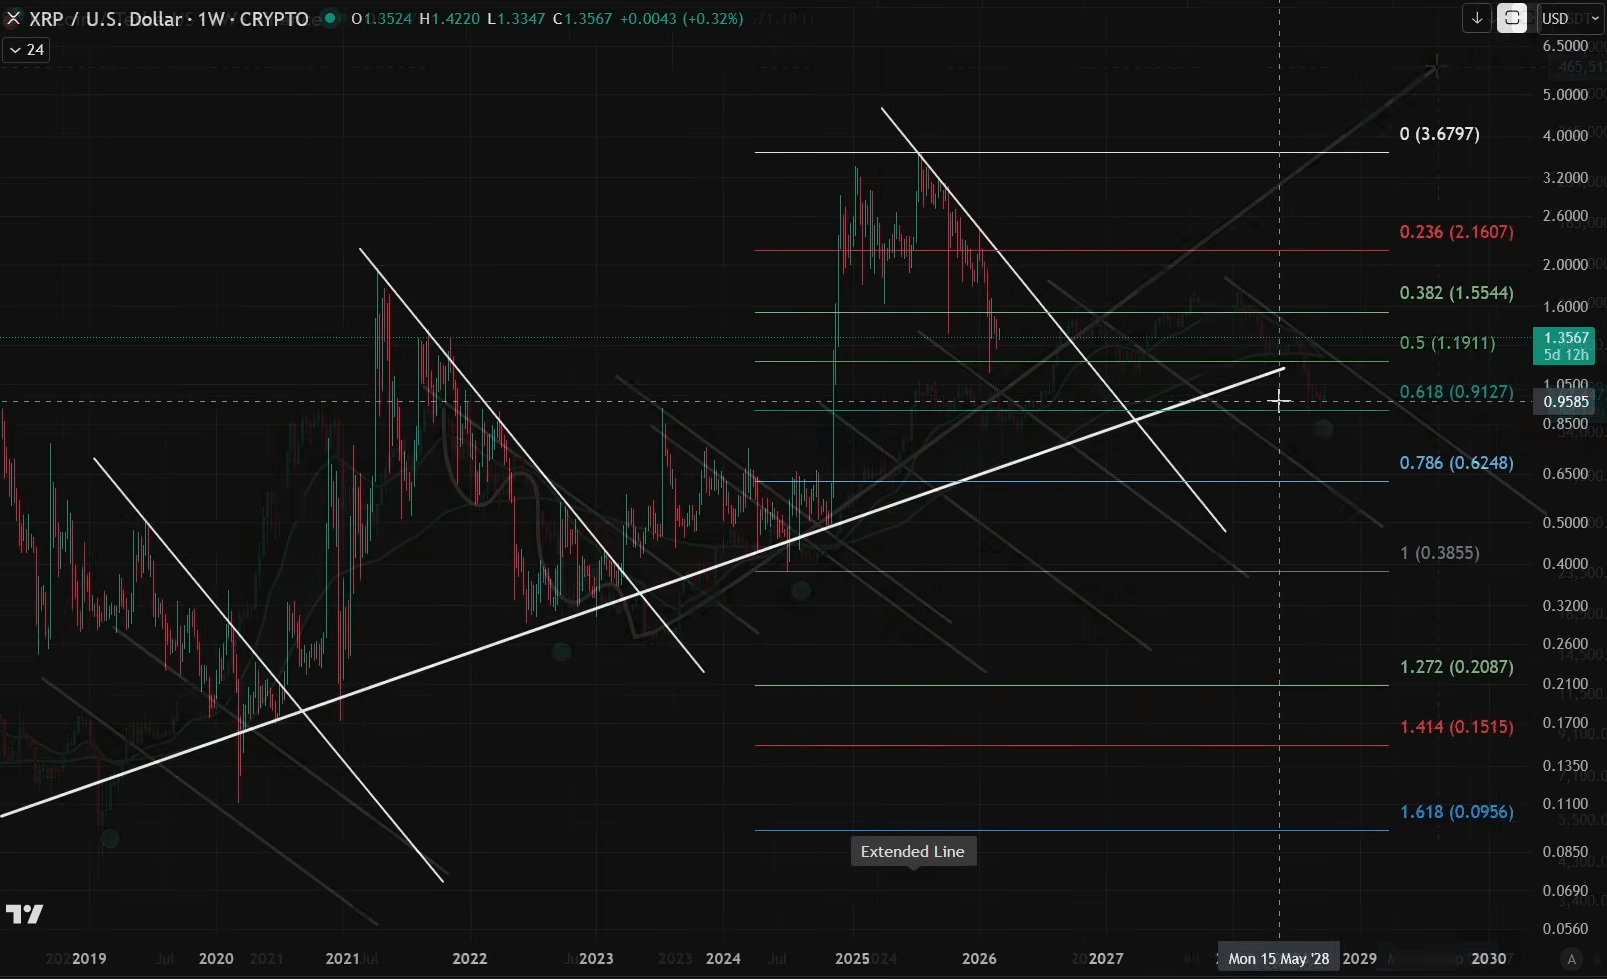
In the past, $XRP touched this trendline several times and bounced. Notably, it did so at $0.11 in March 2020, $0.17 in December 2020, $0.30 in January 2023, and $0.38 in July 2024. Each time, the asset formed higher lows and later moved higher. CoinsKid believes that this long period of price compression along the trendline helped fuel the breakout to $3.4 in January 2025.
However, he warned that a drop below the trendline support and a weekly close below the 0.786 Fibonacci level at $0.6248 would indicate trouble. A drop beneath that level could open the door to losing the Fib. 1 level at $0.3855. If that happens, $XRP could slide further toward the Fib. 1.272 ($0.2087) and Fib. 1.618 ($0.0956) range.
Key $XRP Fibonacci Levels and Resistance to Watch
Speaking further, CoinsKid shared several support levels that traders should watch. Specifically, he pointed to the 0.5 Fibonacci level at $1.19, the 0.618 golden ratio at $0.9127, and the major 0.786 level at $0.6248. According to him, $XRP often pulls back to the 0.618 level before finding support.
On the upside, $XRP faces resistance at a descending trendline that sits near $1.55, which also matches the 0.382 Fibonacci level. To regain strength, $XRP must break above this area. If price dips toward the ascending support trendline first and then rebounds above $1.19 at the 0.5 level, that move could clear the descending trendline and set up a strong third wave higher.
For now, $XRP continues to form lower highs and lower lows, confirming the ongoing downtrend. CoinsKid suggested that traders wait for a clear breakout above the descending trendline instead of trying to predict the exact bottom.
$XRP to $8 Remains on the Table
The analyst noted that he sees the rally to $3.66 in July 2025 as Wave 1 and the current decline as a Wave 2 pullback. He now expects a massive Wave 3 that could send the price into new territory once $XRP holds the ascending support trendline and breaks above resistance.
He also called attention to past breakouts above similar descending resistance lines. In July 2020, $XRP broke above the descending resistance at $0.2 and later climbed to $1.96 by April 2021. In January 2023, it moved above $0.4 and eventually surged to $3.66 by July 2025.
Based on this history, CoinsKid sees $8 as his long-standing minimum target. Meanwhile, over a longer time frame, he even considers $27 possible.