While $XRP has continued to decline alongside the rest of the market, data shows the downturn could present an opportunity.
$XRP continues to trade under pressure, changing hands at $1.36 amid a 26% decline this year. Despite the downtrend, the current structure suggests the pullback may merely be part of an ABC correction, and $XRP could soar above $8 once it clears the major resistance levels.
Key Points
- $XRP currently trades at $1.36, down more than 26% year-to-date and over 61% below its $3.6 peak.
- However, market data indicates that the downtrend may merely be part of an ABC correction within a broader structure.
- This ABC correction began after $XRP hit a peak of $3.4 in January 2025, with the A-wave pushing prices to $1.61, the B-wave leading to $3.66, and now the C-wave resulting in a massive downtrend.
- $XRP recently bounced from the Fib. 1.414 level at $1.14, but the Fib. 1.618 level near $0.9676 remains a possible downside target.
- A break above an existing descending resistance trendline could signal a move toward $8.15 for $XRP, but losing its ascending support would weaken the bullish outlook.
$XRP’s Bigger Picture Remains Bullish
Market analyst CoinsKid shared these important levels during his latest analysis. Notably, the market watcher suggested that once the ongoing downtrend concludes, $XRP could climb to at least $8.15 in the next major move up.
He identified a long-term compression pattern on the 1-week chart that began after $XRP fell from its $3.31 peak in January 2018.
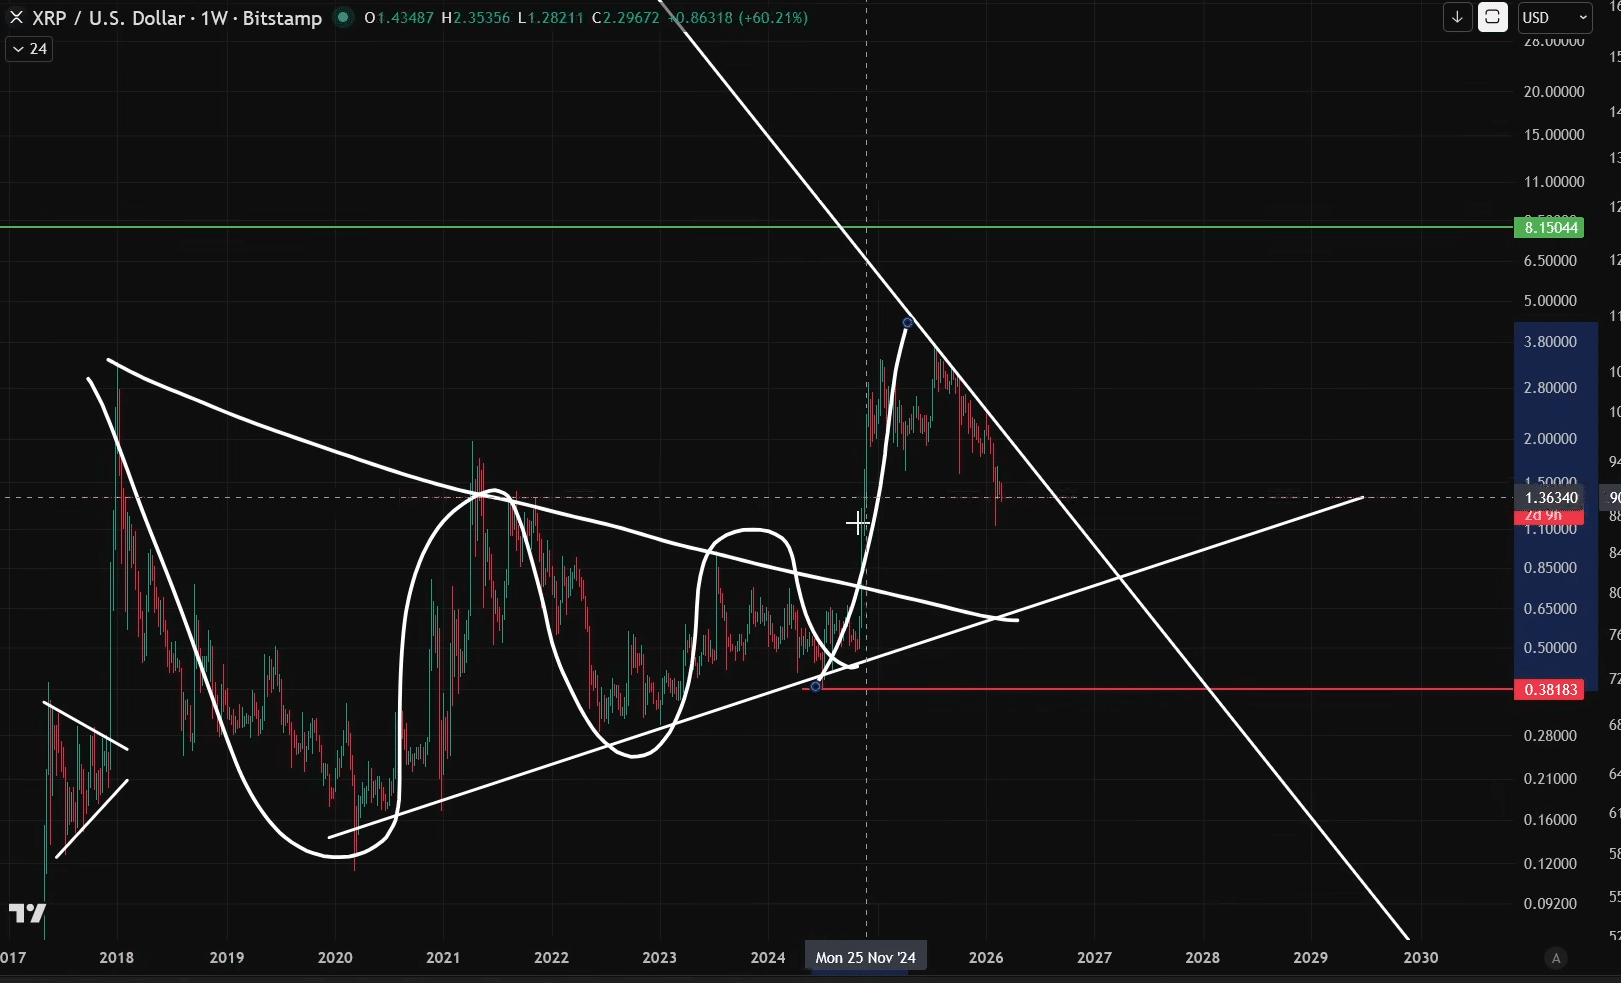
From the $3.31 high, the price declined to $0.11 by March 2020 before rebounding to $1.96 in April 2021. Notably, $XRP then formed a symmetrical triangle featuring lower highs and lower lows, a pattern that persisted until a breakout in November 2024.
From Breakout to ABC Correction
After the November 2024 breakout, $XRP surged from around $0.5 to $3.4 by January 2025. CoinsKid stressed that the move represented a strong wave that cleared major resistance around $0.94 (the July 2023 peak) and $2 (the April 2021 peak). He had expected a push to overcome those levels, and the market delivered exactly that.
Once $XRP hit $3.4 in January 2025, the price entered an ABC correction. The A wave pulled $XRP down to $1.61 in April 2025. The B wave then pushed it to a new all-time high of $3.6 in July 2025. Since then, the C wave has dragged the price back to $1.36.
According to CoinsKid, this decline does not mark the start of a bear market. Instead, he believes the rally to $3.66 represents a B wave and the current drop marks a C wave within a larger structure. As a result, he suggested that the current C wave downturn presents an opportunity for investors.
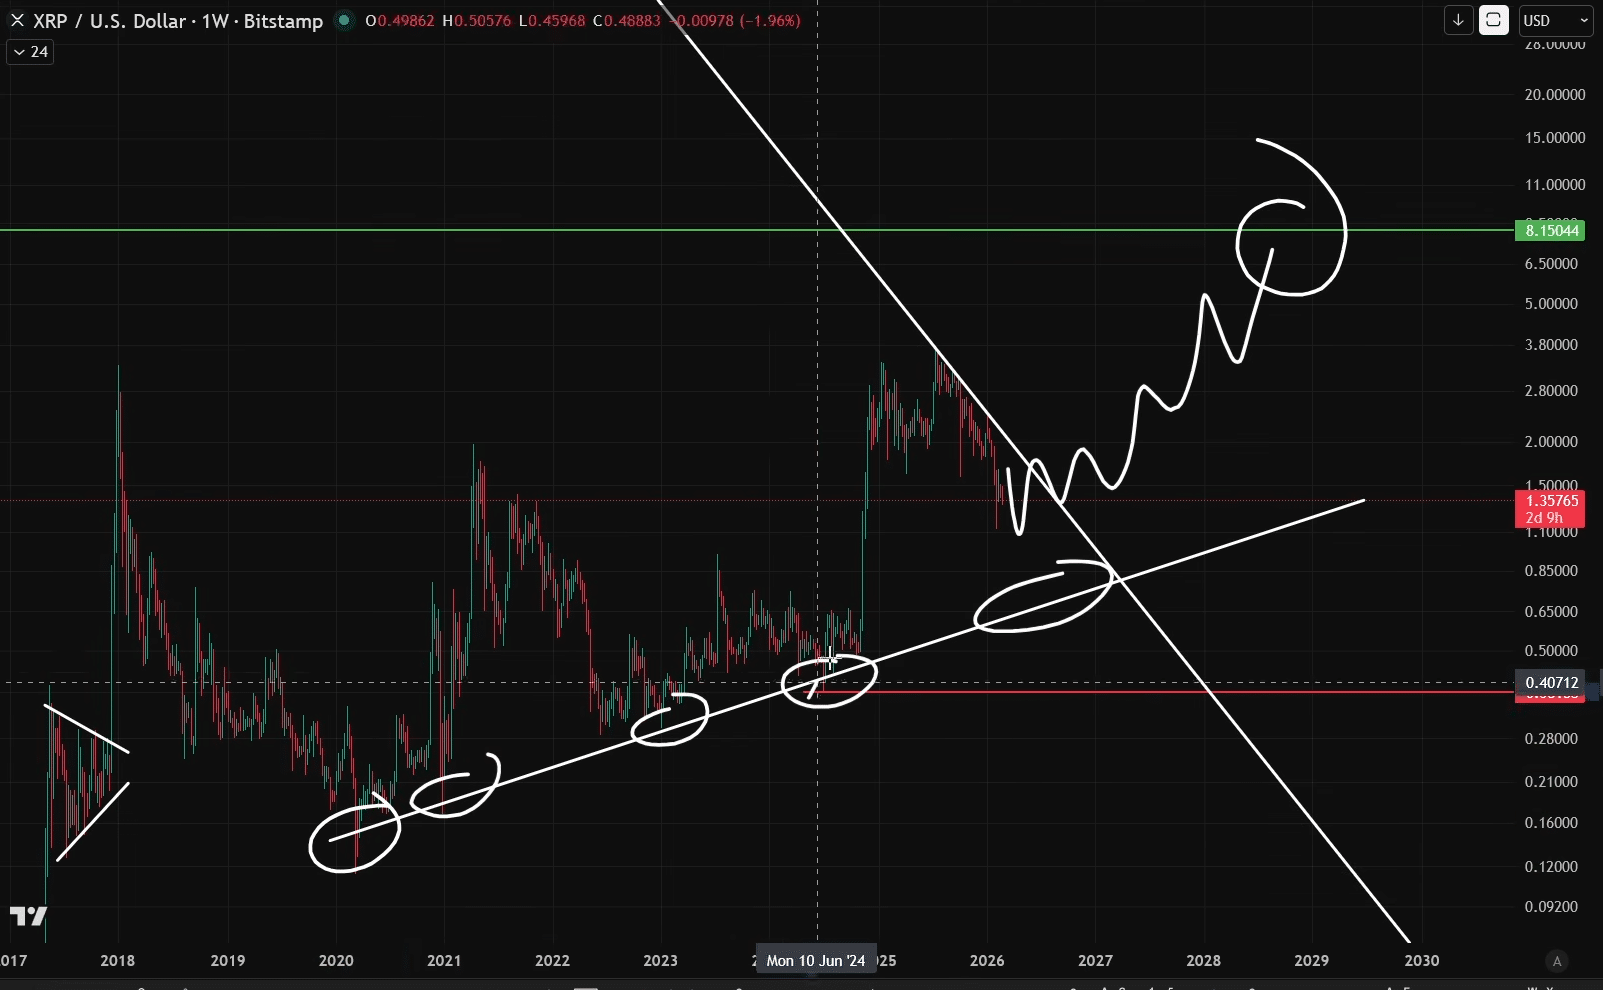
He called attention to similar moments in the past. For instance, $XRP fell to $0.28 in June 2022 during a previous C wave and also dropped to $0.5 in October 2024 in another C wave before rebounding in November 2024. To him, those periods presented opportunities, and the current setup looks similar.
What Needs to Happen for $8.15
Chart data also confirms that since the July 2025 high at $3.6, $XRP has struggled under a descending white trendline, which has kept the price making lower highs. CoinsKid says $XRP must break above that line to confirm the next big move. Right now, that resistance sits between $1.6 and $1.75. If price pushes through that range, he believes it would signal the start of a strong rally toward $8.15.
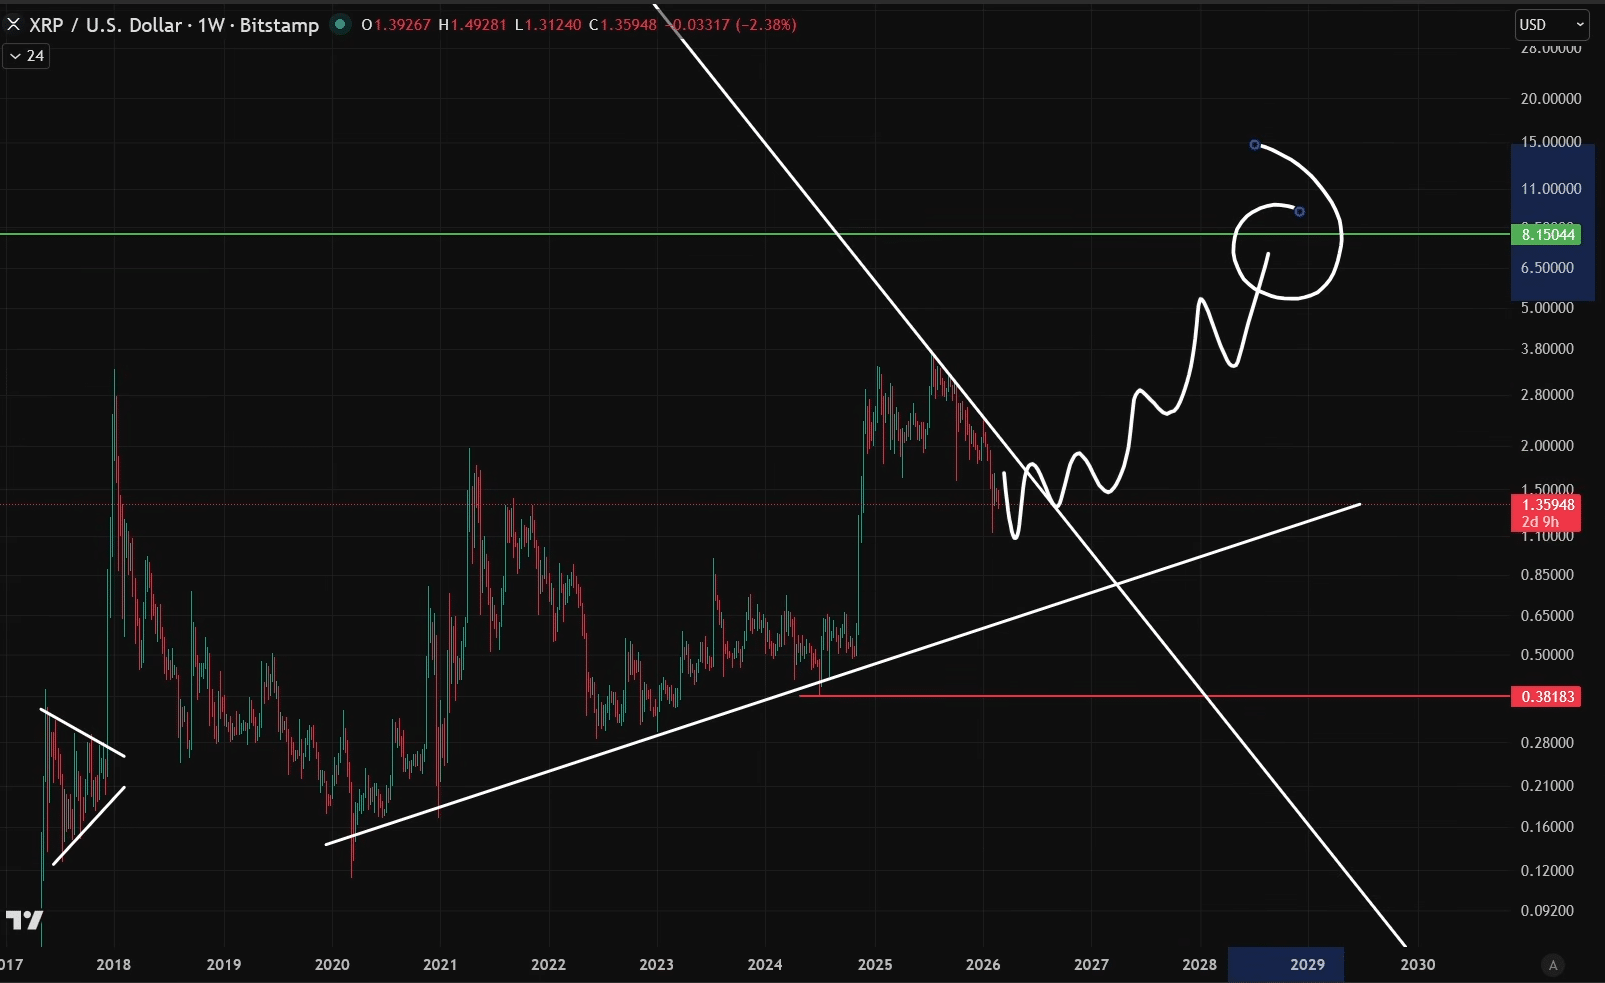
He compared this to early 2023, when $XRP broke above a similar descending white trendline near $0.5. At that time, he turned very bullish. The analyst says he will take the same approach again if $XRP clears the current resistance. This means a breakout above $1.6 to $1.75 could open the door for an impulse wave, especially if the market sees renewed liquidity.
Downside Risk and Key $XRP Support Levels
CoinsKid also shared what would invalidate his outlook. For context, $XRP has also followed an ascending white trendline since 2020, which has provided strong support during downturns. Notably, the support now lies between $0.73 and $0.85.
The analyst insists that as long as the price stays above that range, the larger structure remains intact, with a wave one completed and an ABC wave two forming before a major third wave higher. However, if $XRP drops below the $0.73 to $0.85 support zone, his bullish scenario would weaken.
He also called attention to important Fibonacci levels. Notably, $XRP recently bounced from the Fibonacci 1.414 level at $1.14, showing a strong reaction. However, CoinsKid does not believe the market has confirmed a bottom yet. He thinks the price could fall further toward the Fibonacci 1.618 level near $0.9676, which aligns with the July 2023 high, before turning around.