Solana shows early reversal signals as Parabolic SAR flips bullish and short liquidations surge across derivatives markets.
Solana ($SOL) is trading at $88.26, posting a 7.2% gain over the past 24 hours and signaling strong short-term momentum. The intraday chart shows $SOL climbing steadily from the low $82 region before accelerating sharply toward the $90 mark, briefly approaching the upper end of its daily range at $90.65.
After peaking, the price action retraced modestly and is now consolidating near $88, suggesting buyers remain active despite some profit-taking. The 24-hour range spans from $82.35 to $90.65, highlighting significant volatility and upside expansion during the session.
Performance metrics across broader timeframes show mixed trends: $SOL is up 8.1% over 7 days and 9.6% over 14 days, indicating strengthening short-term momentum. However, it remains down 28.8% over 30 days. The key question now is whether this surge marks the start of a sustained breakout.
Has Solana Carved Out a Base?
On the daily chart on TradingView, Solana is showing early signs of trend stabilization as the Parabolic SAR dots at $75.67 have shifted below the price. This flip typically indicates that downward momentum has weakened and that buyers are beginning to regain control.
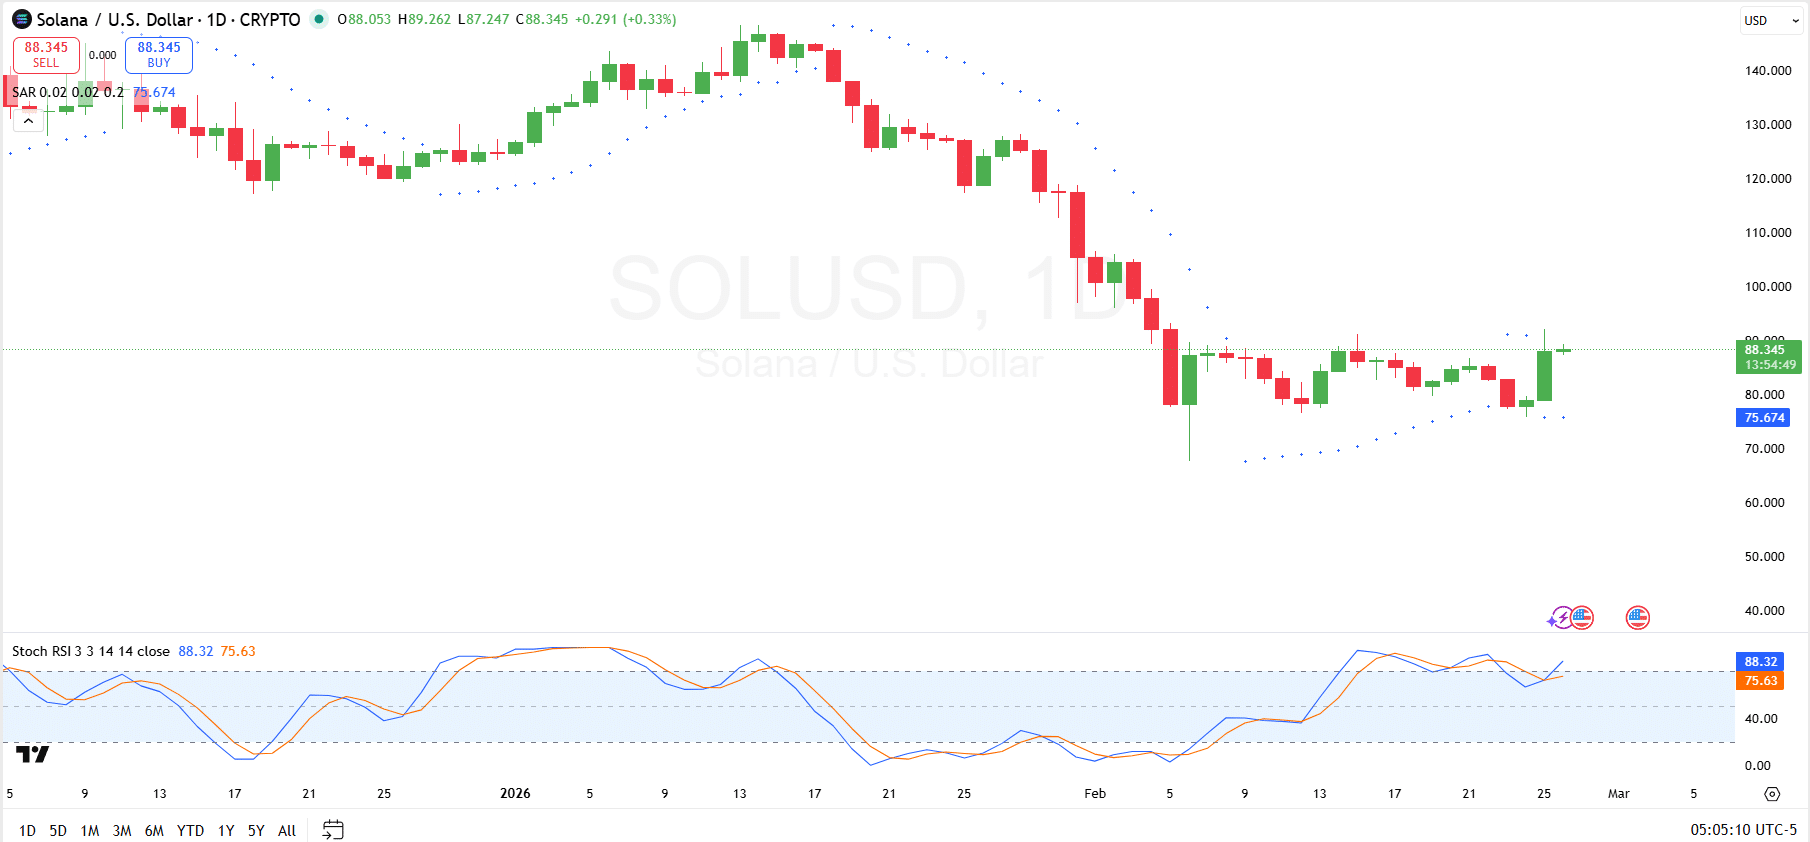
After a prolonged decline from higher levels, $SOL could have carved out a base near the recent lows and is now attempting to build higher lows around the mid-to-high $80 region. However, it depends on if Solana can hold the support at the SAR.
Notably, momentum indicators further support this developing recovery. Specifically, the Stochastic RSI is elevated, with the %K line near 88 and the %D around 75, placing the oscillator in overbought territory. This reflects strong short-term momentum, although it also signals that $SOL could face minor pullbacks or consolidation before extending higher.
Solana Liquidation Data
Solana’s liquidation data shows elevated volatility across multiple timeframes, with a clear imbalance between long and short positions. Over the past hour, total liquidations reached $268.89K, with shorts accounting for $256.66K compared to just $12.24K in long liquidations.
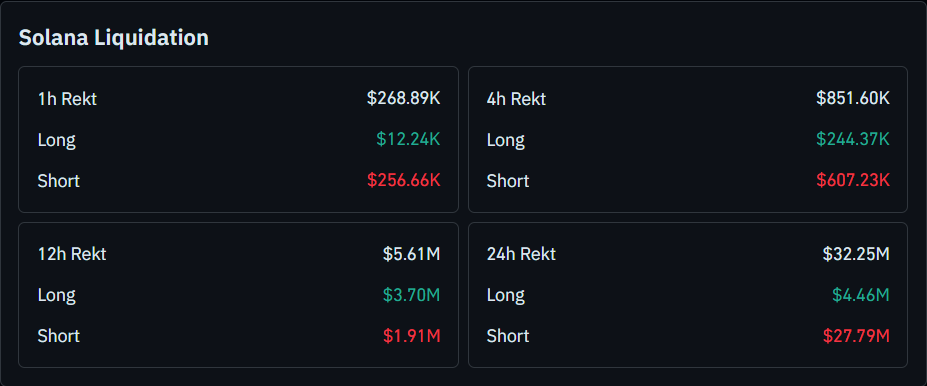
A similar pattern is visible on the 4-hour timeframe, where total liquidations stand at $851.60K, including $607.23K in shorts versus $244.37K in longs. This suggests that recent upward price movement has triggered a wave of short liquidations, reinforcing short-term bullish pressure.
Further, total liquidations over 24 hours amount to $32.25M, with shorts contributing $27.79M, but long liquidations also remain significant at $4.46M. Meanwhile, the 12-hour window shows $5.61 million in total liquidations, with longs ($3.70M) exceeding shorts ($1.91M).