
TL;DR:
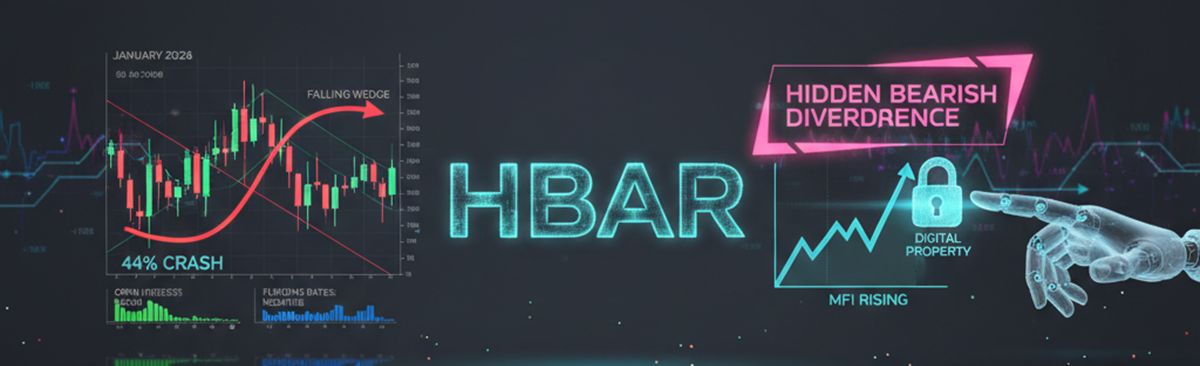
- Hedera presents a “hidden bearish divergence” on its daily chart, a pattern that previously preceded a 44% drop.
- Unlike the last cycle, open interest is lower and negative funding rates reduce the risk of massive liquidations.
- The Money Flow Index (MFI) suggests that buyers are capitalizing on corrections to accumulate the asset.
A familiar technical pattern has reappeared, and the crypto market is shifting its focus toward the Hedera (HBAR) price. At the time of writing, the asset was fluctuating within a falling wedge, a formation that typically precedes bullish breakouts; however, a divergence between price and the RSI has raised alarms among analysts.
This is a hidden bearish divergence, a technical signal suggesting that despite recovery attempts, sellers maintain control of the overall momentum. Although this same indicator triggered a crash of over 40% in January, current metrics indicate that the market structure is significantly more robust.
Because of this, the community is closely watching the asset’s interaction with its 20-day exponential moving average (EMA), which acts as a key dynamic resistance. If support holds against selling pressure, the massive capitulation scenario experienced previously might not repeat this time.
Key Differences in Trader Positioning and Critical Levels
Unlike the previous crash, open interest is currently near $61 million, reflecting much lower leverage. Additionally, negative funding rates indicate that traders are not betting aggressively on a price increase, which avoids the risk of a forced liquidation cascade.
In the short term, fundamental support levels are found at $0.092 and $0.083, zones where buyers have shown resilience. Conversely, to achieve a solid recovery, the asset must reclaim the $0.107 zone, which would pave the way toward higher targets.
In summary, although Hedera faces a known technical warning signal, the improvement in capital inflow (MFI) suggests that demand is absorbing the supply. The definitive direction will depend on whether the price manages to break the wedge resistance or succumbs to historical bearish pressure.