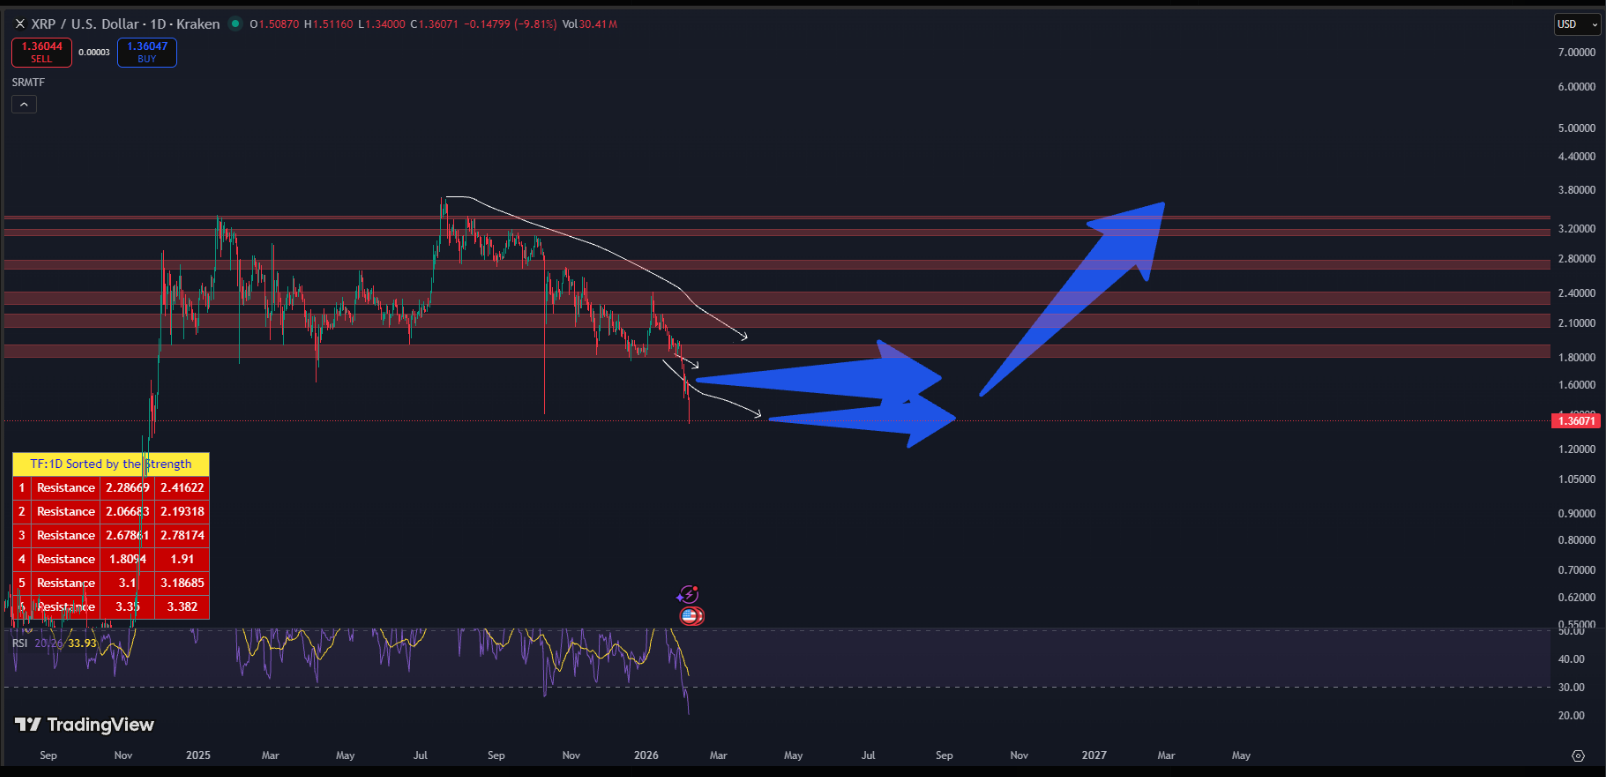
$XRP’s recent slide has left traders asking whether the worst is over. Prices have been weak since Q4 2025, and reports say the token has lost roughly half its value from an October opening near $2.80 to about $1.42 as we speak. That drop came with a sharp move in momentum indicators, which traders rarely ignore.
Extreme RSI Readings Near A 12-Year Low
According to market reports, the daily relative strength index fell to about 17 on Feb. 5, pushing readings to levels not seen in over a decade. That is an extreme number for RSI on a daily chart.
When readings hit this depth, past action has often produced strong, quick rebounds. History does not promise a repeat, but it does give a pattern that many traders watch closely.
Patterns From The Past Offer Both Hope And A Warning
Reports note several prior episodes when low RSI numbers lined up with sharp recoveries. After an October low, a bounce of roughly 70% came in just nearly half a month.
Other lows in mid-2024 and April 2024 produced gains of about 65% and 35% within short windows of days. Those moves were fast, and they were driven by buyers jumping in when momentum looked exhausted.
Still, past rebounds can be followed by renewed selling, and what happened before isn’t guaranteed to happen again.
$XRP just hit an RSI of 20 on the daily—the most oversold it’s ever been in its history.
Every single time $XRP has hit these extreme levels, a 15-40% bounce followed within two weeks. Not sometimes. Every time.
Relief bounce to $2.20-$2.50 is the highest probability setup we’ve… pic.twitter.com/F8e7WBRbyu
— Ripple Bull Winkle | Crypto Researcher 🚀🚨 (@RipBullWinkle) February 5, 2026
Major Bounce In The Offing?
A vocal market commentator, crypto researcher Ripple Bull Winkle, has pointed to those patterns and argued that a 15%–40% bounce often follows such extreme readings.
Based on reports, that view has traction with some traders, who are watching for signs of a short squeeze or a flush that shakes out weak hands.
Other traders caution against leaning on a single signal. The broader market, macro news, and funds’ behavior can overwhelm technical cues.
Large short-liquidity zones above $2.25 and between $4.20 and $4.40 are on the chart; if price hits those spots, moves can accelerate quickly.
$XRP’s Position Versus Major Coins
$XRP has not been alone in losing ground, but its pair trades show some relative strength. The $XRP/ETH pair has been in a range since August 2025, and $XRP/BTC recovered after a brief breakdown.
Dominance metrics have held near the 3.5% area and have even bounced to roughly 3.6%. These data points mean $XRP isn’t collapsing in isolation; it’s moving inside a market that’s broadly weak.
What Traders Might Watch Next
Volume will matter. So will daily closes above key resistances and whether the RSI climbs out of extreme territory with conviction. A clean break above the $2.25 level could put the next targets in view, while failure to sustain a bounce would likely keep sellers in control.
Risk control is expected to be important; many moves after deep oversold readings were sharp but short-lived, so position sizing and stop rules have a practical role.
For now, reports say the setup is one of opportunity and danger at once. Traders who are watching momentum see a chance for a quick recovery.
Others note that structural selling and wider market pressures could blunt any rally. Either way, the coming days should show whether this is a relief bounce or the start of something larger.
Featured image from Shutterstock, chart from TradingView