$XRP is currently trading below its key Simple Moving Average, but an analyst on X expects a move to the upside.
$XRP has faced significant downward pressure in the past 24 hours, seeing a 6.7% decline, with the price currently sitting at $1.7572. During this period, it has fluctuated between a high of $1.8887 and a low of $1.73.
This decline reflects persistent challenges, as $XRP has also experienced losses of 8.6% in the last 7 days and 6.3% over the past 30 days. The recent downtrend is further highlighted by its year-to-date loss of 4.5%, adding to the continued negative performance seen over the last year, where $XRP has declined by over 42%.
The long/short ratios on various platforms show an ongoing bullish sentiment, particularly on Binance and OKX, where the long-to-short ratio is higher than 2.5, signaling that traders are still positioning for upward movement. However, the price action continues to struggle against resistance levels, leaving traders watching for potential signs of recovery or further declines.
$XRP Price Analysis
In the 4-hour $XRP chart, the price is currently trading below the 9-period Simple Moving Average, which is now acting as a key resistance level at $1.8247. This is a crucial area for $XRP to break above to initiate a potential upward movement. The price has been unable to surpass the SMA in previous hours, indicating that the bears have the upper hand at the moment. Notably, further declines may be possible unless this resistance gives way.
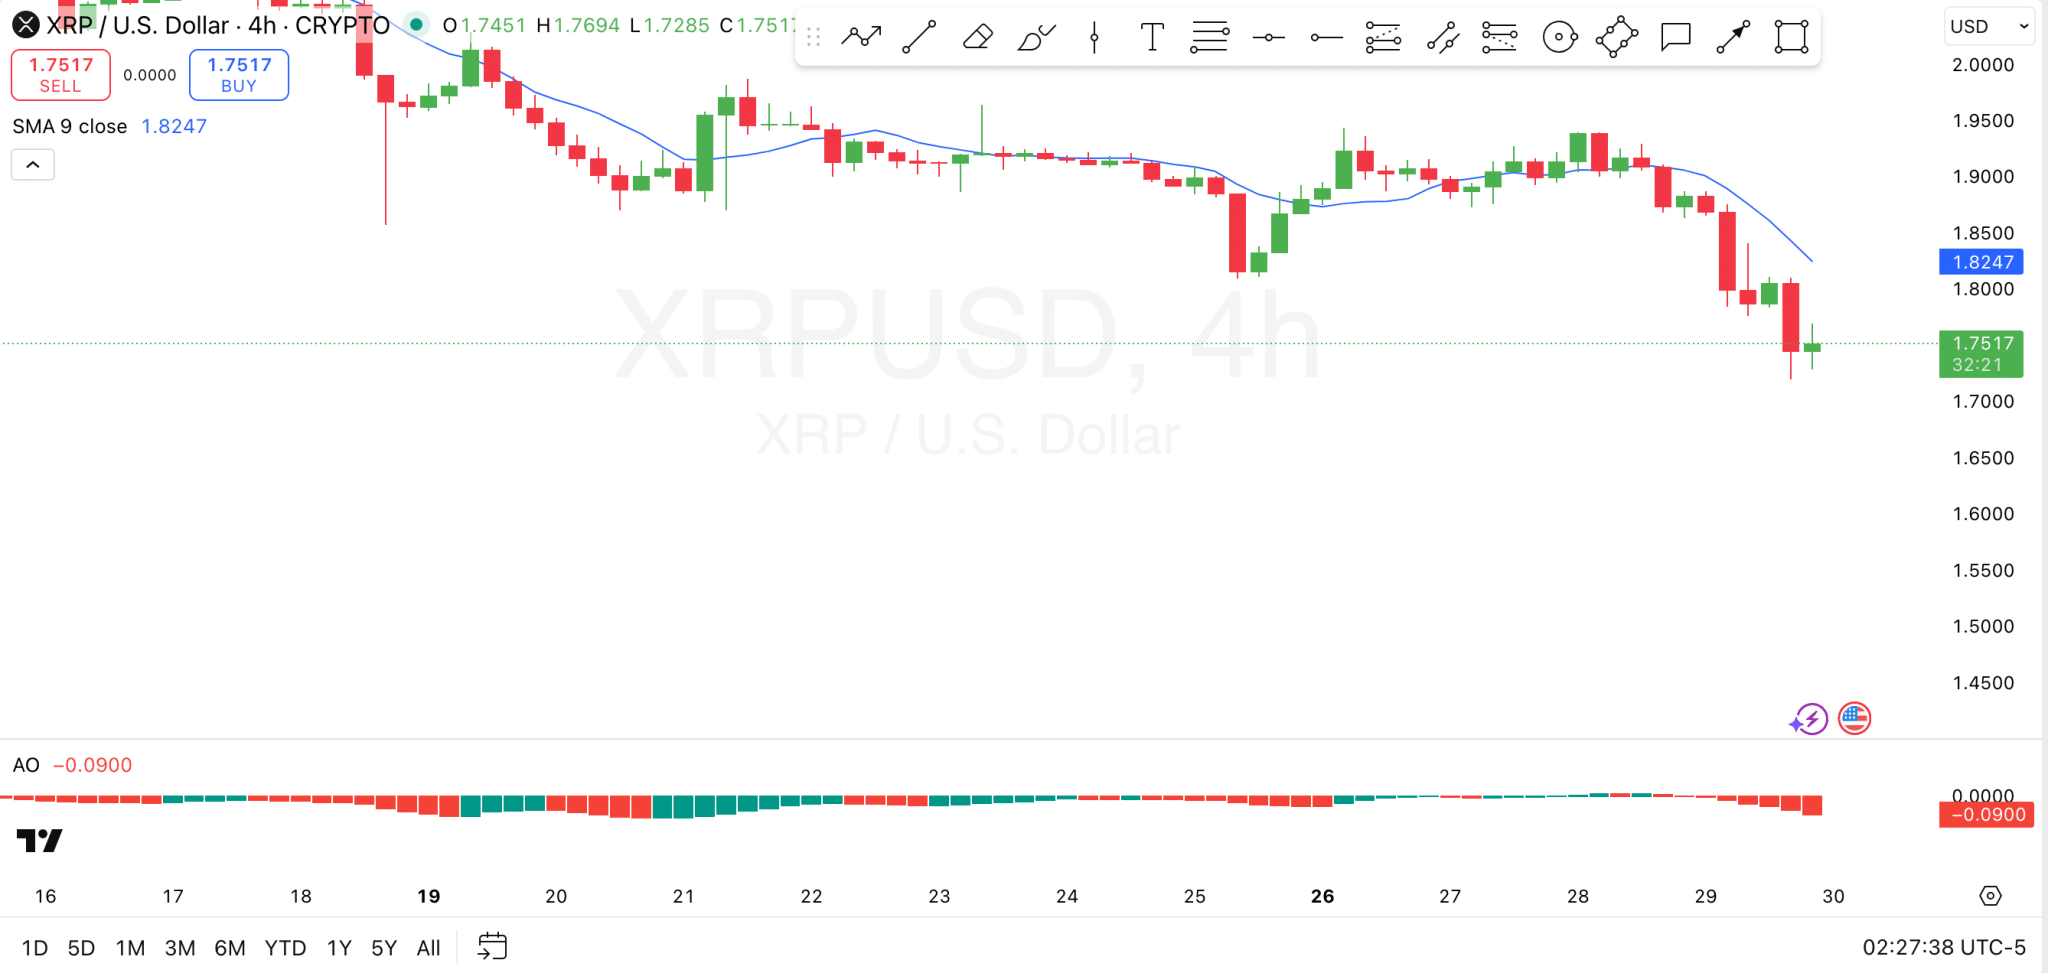
Looking at the support level, $XRP is testing the $1.72 mark, which serves as an immediate support level. If the price fails to hold above this level, further declines toward the next key support zone around $1.70 could be imminent.
Also, the Awesome Oscillator is showing a negative reading of -0.0900, reinforcing the bearish momentum. The red histogram bars also indicate that selling pressure dominates. Overall, a sustained crossover above the SMA, along with a shift in the AO towards positive territory, will be key signals for a potential bullish reversal.
Here’s $XRP’s Next Move
On the social media commentary side, analyst Amonyx recently shared a compelling $XRP chart, highlighting a potential bullish move ahead. The chart shows $XRP in a consolidation zone within a descending triangle, marked by a declining trendline and support at the lower range. These levels have been holding $XRP from breaking out in either direction.
After defending the support line, Amonyx expects $XRP to initiate an upward move, but must breach the descending trendline. Notably, Amonyx’s chart points to a target above $4.6 if the pattern works out.