The price of $XRP has continued to crumble under persistent bearish pressure, and some market analysts believe the bears are only just getting started.
At press time, the price of $XRP is down 5% over the past week, trading at $1.88. The coin touched $1.80 over the weekend, its lowest level so far this year. This move completely wiped out $XRP’s year-to-date gains.
Key Points
- $XRP’s Price Decline Continues: $XRP has dropped 5% over the past week to $1.88, erasing its year-to-date gains and reaching its lowest level this year.
- Potential for Deeper Downward Movement: Technical analyst The Great Martis warns that $XRP may face further downside, possibly testing the $0.50 level, if support near $2 fails.
- Significance of the $2 Support Zone: The $2 support is a critical decision point; repeated tests may weaken it, with a breakdown potentially leading to a substantial decline.
- Market Outlook and Investor Caution: Despite bearish signals, analysts advise against panic, framing the decline as part of a larger market cycle, with potential for a new bullish trend.
- Bullish Predictions and Long-term Targets: Some analysts remain optimistic, predicting $XRP could reach $11 or even $70 in the coming years, contingent on historical pattern repetitions.
$XRP Dip Not Over
In a tweet, a widely followed technical analyst known as The Great Martis warned that $XRP may face deeper downside pressure in the coming months. He argued that the market is still moving through a corrective process rather than forming a final bottom.
In an accompanying chart, the analyst highlighted $XRP’s current position around a long-standing critical support zone near the $2 level. This range has acted as a base through several months of consolidation. According to the analysis, this zone represents a structural decision point rather than a sign of strength.
The chart suggests that $XRP’s previous rally has transitioned into a distribution phase, with price action flattening and momentum gradually fading. While $XRP has not yet broken down decisively, the analyst notes that repeated tests of the same support often weaken it over time.
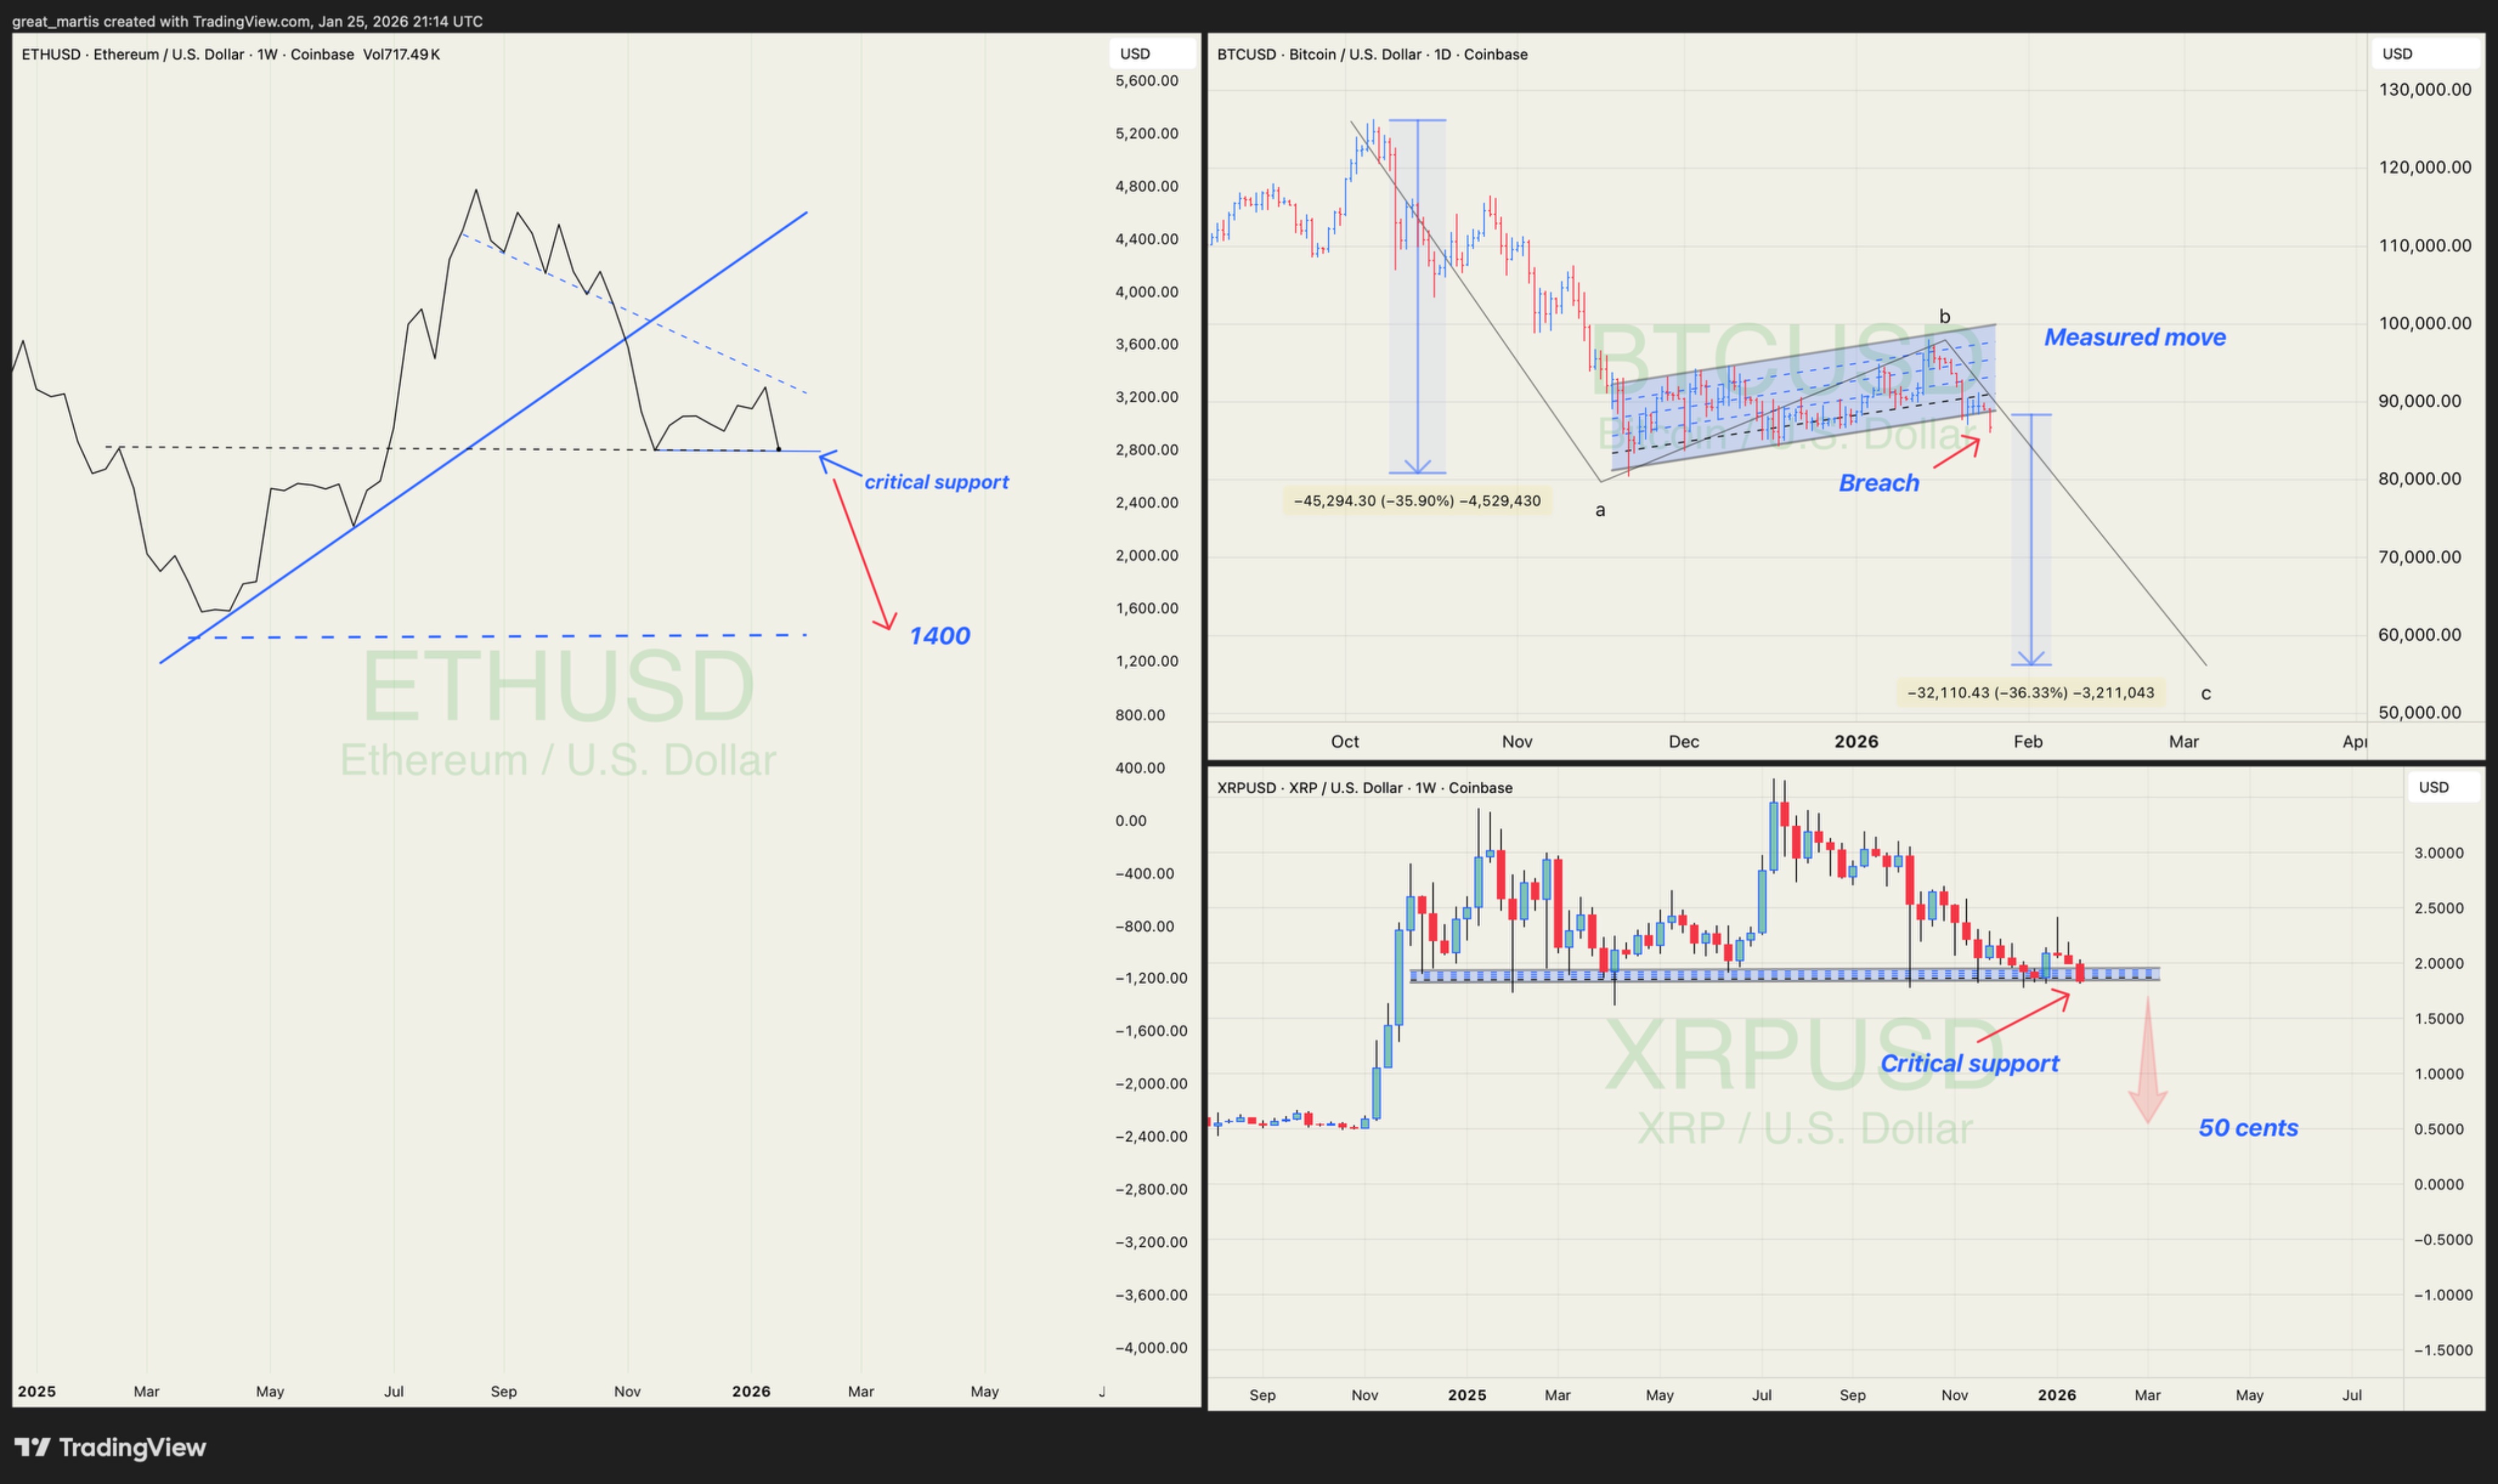
Dip to $0.50 Level in View
If this $2 support fails, the chart projects a much deeper corrective move, with downside targets extending toward the $0.50 region. This area previously served as a major demand zone before $XRP’s last expansion.
For context, $XRP’s price would have crashed by 73% from the current level of $1.88 if it reaches $0.50. Meanwhile, considering its peak of $3.66 in July 2025, this would represent a price loss of over 86%.
Notably, the analyst framed the projected move not as a sudden crash, but as a measured, technical continuation within a larger market cycle.
Despite the bearish outlook, the analyst cautioned against emotional reactions, emphasizing that market declines tend to unfold in stages.
“Don’t panic. It gets much worse,” the analyst wrote, adding that the current phase should be viewed as part of a broader process rather than an unexpected breakdown. “It’s a process; let it process.”
Analyst Still Calling for Major Bull Run This Year
At the time of writing, $XRP continues to trade just above its highlighted support, leaving the market in a critical position.
Meanwhile, some market watchers remain bullish on $XRP. CryptoBull recently said $XRP’s current price structure mirrors past bull cycles, featuring an even longer consolidation phase.
Based on weekly chart patterns, CryptoBull sees $11 as the first major target—nearly a 6x move. He adds that if the full historical pattern repeats, a final wave could eventually push $XRP as high as $70, though that would likely take years.
For now, $XRP remains in a tight range, with analysts suggesting at least another year of accumulation before a move toward double-digit prices.