
Bitcoin Cash ($BCH) traded around $579 at the time of writing on Monday, January 26.
While price remained largely constrained, bulls displayed signs of a potential bullish turnaround, this likely flip coming after the latest rejection at the $600 resistance level.
Given, broader market pressures, including Bitcoin’s recent struggles following its dip from a $93,000 high, could dictate direction.
Bitcoin Cash price performance
Copy link to section
Bitcoin Cash experienced a sharp rejection near the $600–$630 zone in the past week, dropping to lows near $565.
This followed a period of volatility, with $BCH fluctuating amid profit-taking and reduced trading volume.
But despite a 3% decline in the past 24 hours and 6% this past week, the asset remains above $550.
The uptick from intraday lows outlines underlying accumulation amid overall altcoin weakness.
So while the $600 level could continue to act as a stubborn supply barrier, buyers have a chance at retesting it.
Another rejection that mirrors the broader crypto trend, where assets like Ethereum and Bitcoin face similar hurdles, will jeopardise this outlook.
Bitcoin Cash mirrors $BTC
Copy link to section
As noted, Bitcoin’s slide to below $87,800 acted as a key catalyst for broader market moves.
The pullback extended into early Monday, with $BTC struggling to hold near the $88,000 level.
Most major altcoins followed the same pattern, including Bitcoin Cash ($BCH), triggering heavy liquidations across the market.
While some smaller-cap tokens showed limited decoupling, $BCH appears to be waiting for a clearer direction from Bitcoin.
Ongoing consolidation, as buyers stepped in on dips, suggests $BTC could remain range-bound between $87,000 and $93,000 in the near term.
$BCH’s rejection near the $600 level reflects a similar setup. However, like Bitcoin, it remains positioned for a potential rebound.
A sustained move by $BTC back above $93,000 could prompt renewed capital rotation into altcoins.
$BCH technical analysis
Copy link to section
Technical charts point to key bullish reversal signals for Bitcoin Cash in the short term.
Among these is a prominent rounding bottom pattern on the daily timeframe, which began after a September 2025 rejection at $630 and a drop to $446.
Currently, the retest of higher lows and compressing volatility suggest fading seller control.
The flip side is buyer accumulation, with a decisive close above the $600–$630 neckline key to confirming the breakout.
In this case, Bitcoin Cash needs to flip resistance to support, in which case, the $700-$800 zone becomes the next target range.
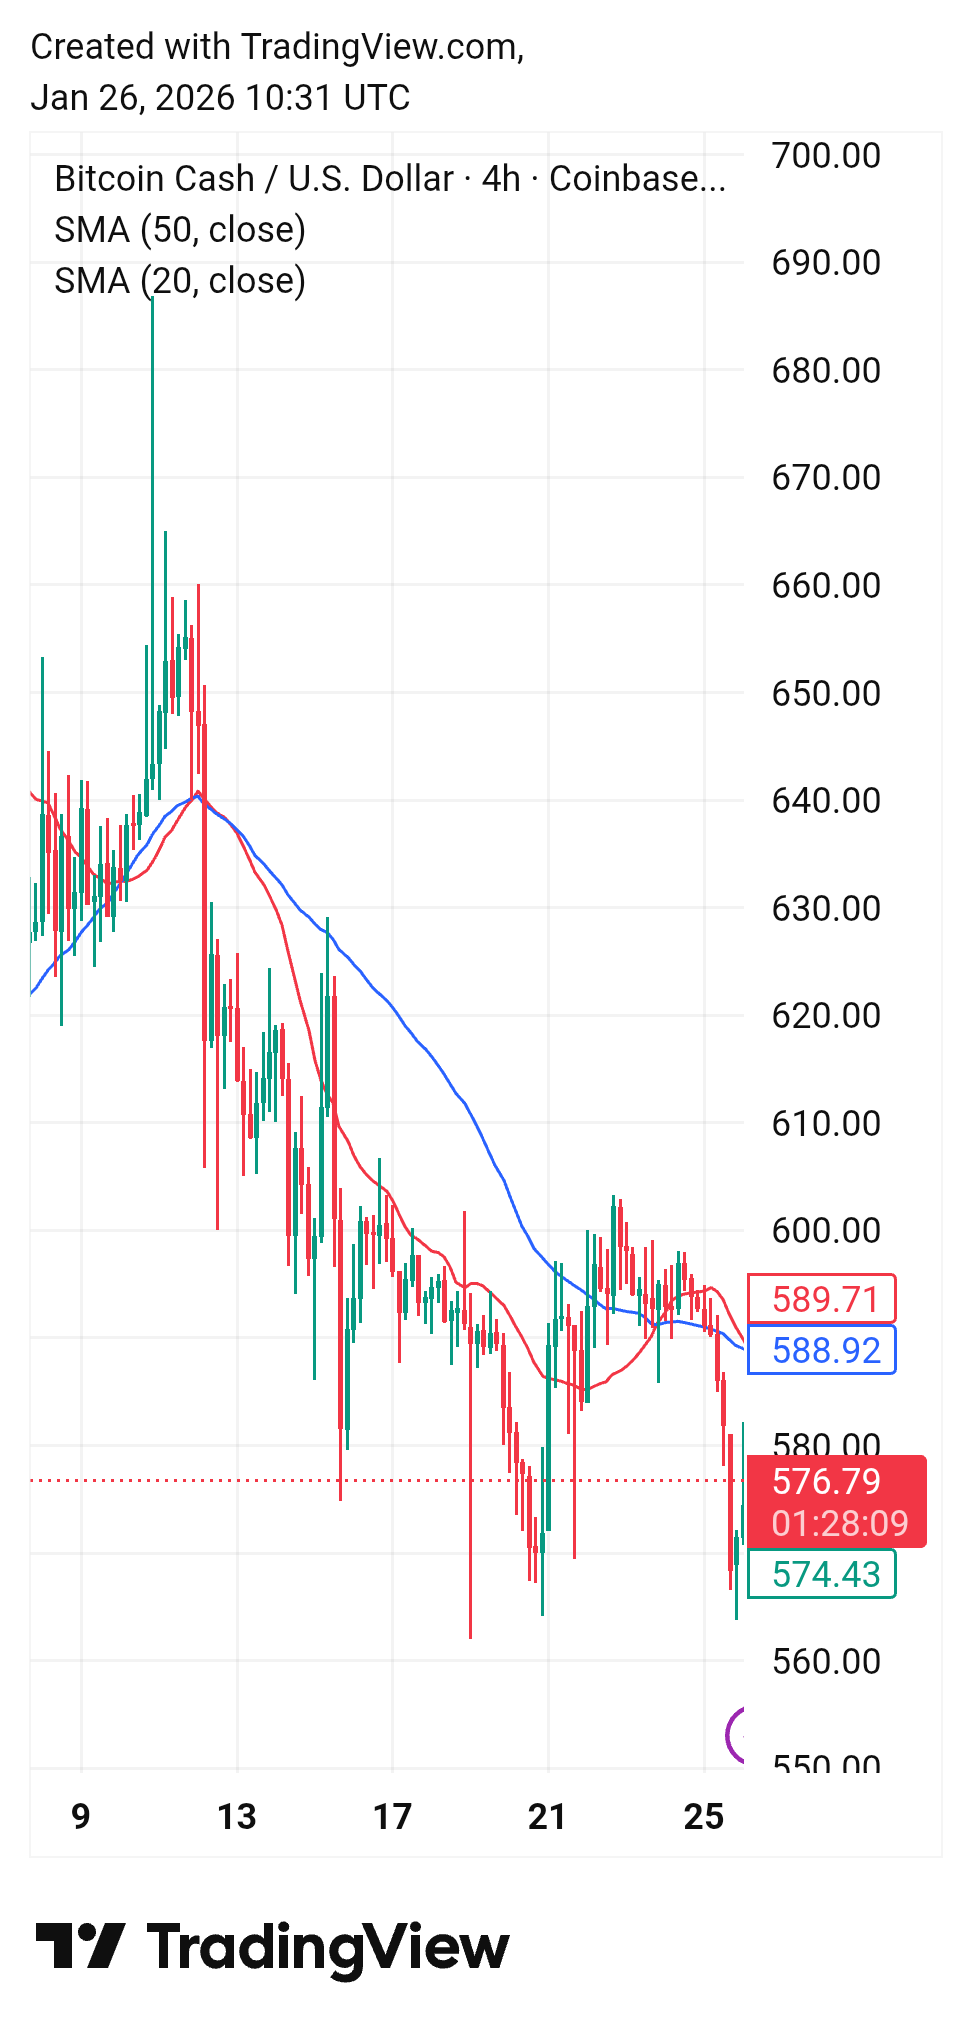
Additional pointers include price bars holding above downward-trending moving averages on the 4-hour chart.
The short-term bullish momentum score points to current prices as potential entries, with $550 a major support level.
Also, the proximity to the 50-day SMA stands as a pivotal test level.
If there’s a broader market breakout, a move above $600–$630 could initially propel $BCH toward $620–$650.
An extension to $800 will follow if the rounding bottom validates.
Failure at $590–$600 could lead to $558 or $509 pullbacks.
The retest of the support levels could attract dip buyers amid Bitcoin’s stabilisation, and sustained higher lows could preserve the reversal setup.