
$XRP price remained in a consolidation phase this week as volume in the spot market waned and exchange-traded funds suffered the biggest outflow ever.
- $XRP price has formed a bearish pennant pattern on the eight-hour chart.
- This pattern points to more downside in the coming days.
- Spot $XRP ETFs suffered a $40 million outflow this week.
Ripple ($XRP) token was trading at $1.9172, where it has remained at in the past few days. This price remains 20% below the year-to-date high of $2.41.
SoSoValue data shows that spot $XRP ETFs had their worst week since their inception in November last year.
These funds experienced over $40 million in outflows this week, bringing the cumulative inflows since their inception to $1.23 billion. It was the first time that these funds experienced weekly outflows, with 21Shares’ TOXR being the most affected.
$XRP price also wavered as third-party data shows that the Ripple USD ($RLUSD) stablecoin is no longer growing as it did in the past. The stablecoin has a market capitalization of $1.3 billion, a range it has remained at in the past few months.
Still, on the positive side, Binance decided to list the $RLUSD stablecoin this week, making it available to millions of its customers. Also, the stablecoin will likely benefit from the upcoming expansion to other chains through a Wormhole integration.
$XRP’s weakness mirrors that of other cryptocurrencies, which have remained on edge in the past few weeks. Bitcoin price has dropped to $89,000, while Ethereum has dropped below $3,000.
One reason for the weakness is that investors have rotated to the better-performing stock market, with the Dow Jonesand the S&P 500 indices hovering near their all-time highs. Precious metals like gold and silver have all jumped to a record high this year.
$XRP price technical analysis
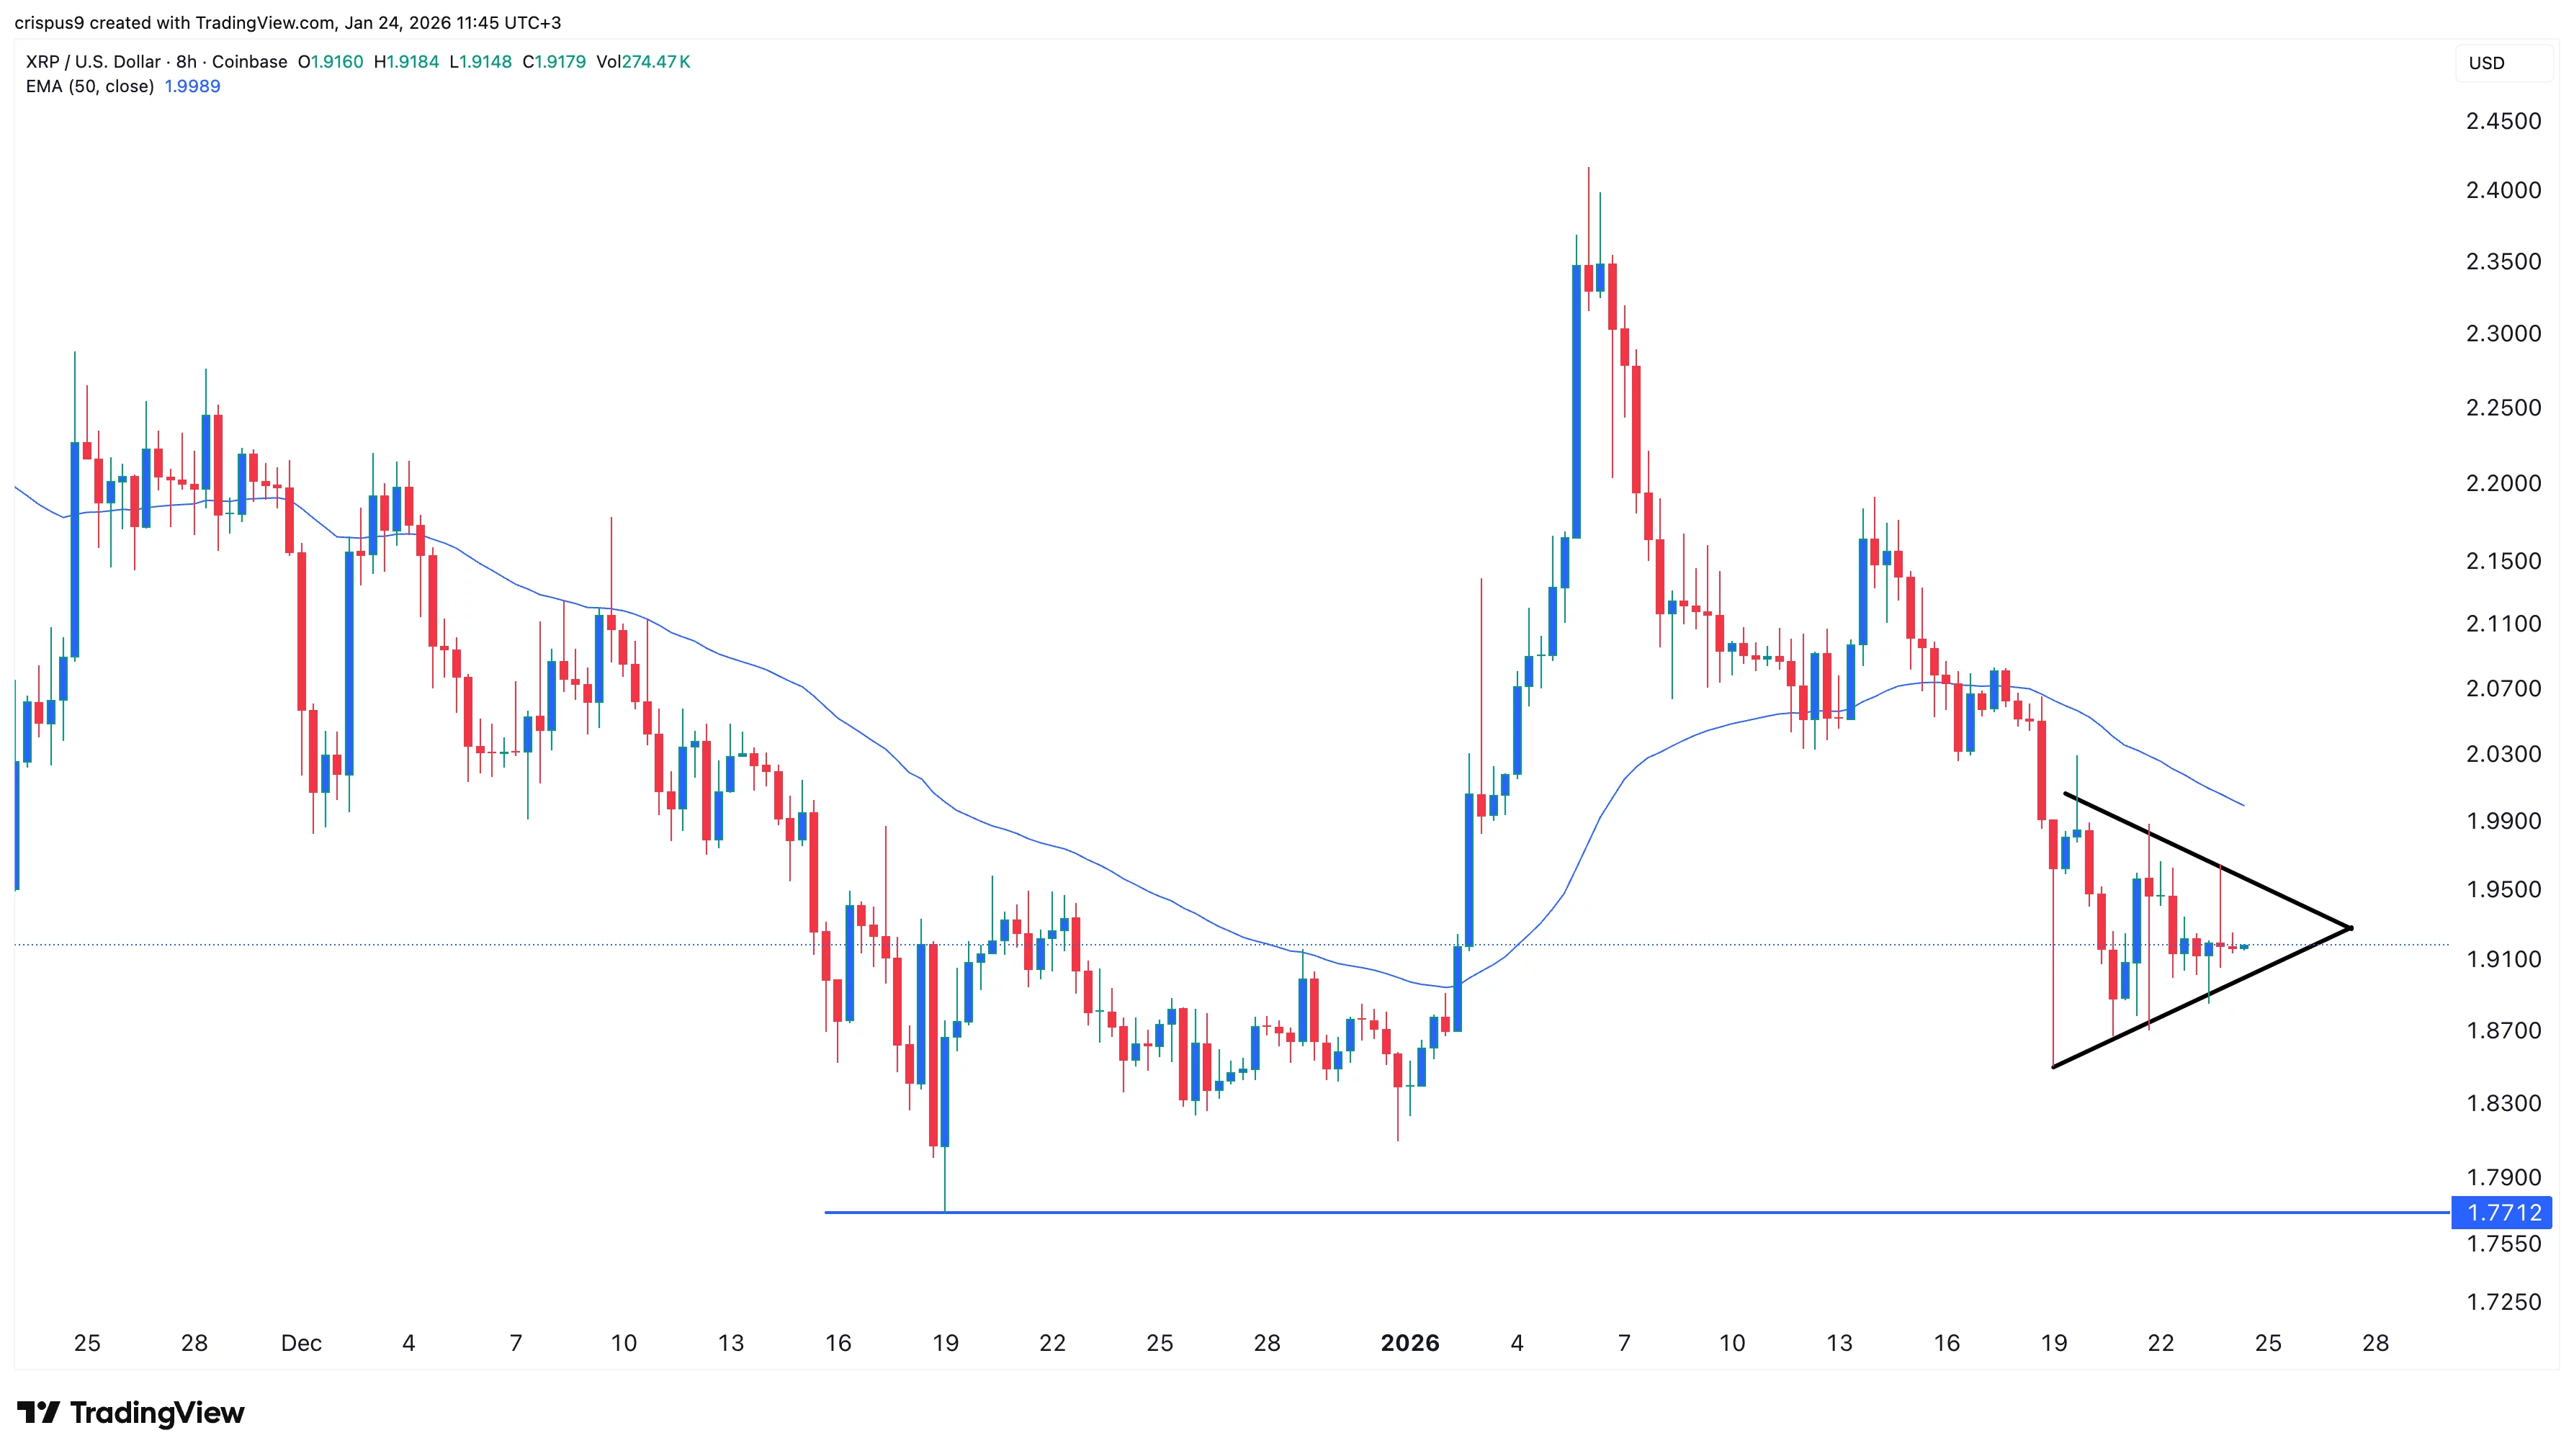
The eight-hour chart shows that the $XRP price has retreated in the past few weeks, moving from a high of $2.4145 to the current $1.9175.
A closer look shows that the token has remained below the 50-period and 50-period Exponential Moving Average, a sign that bears are now in control.
The token has also formed a bearish pennant pattern, which is made up of a vertical line and a symmetrical triangle. This triangle pattern is nearing its confluence, which will lead to a bearish breakdown in the coming weeks.
Such a drop will likely see it drop to the next key support level at $1.7712, its lowest level on December 19. This target is about 7.65% below the current level.