
The cryptocurrency market is consolidating following its poor performance this week. Bitcoin is trading above $89k, while Ether has failed to recover above $3k.
Meanwhile, $XRP, the fifth-largest cryptocurrency by market cap, is consolidating above $1.90, a short-term support level.
It risks dropping below this level despite ETF inflow into the ecosystem.
$XRP stays below $2 despite fresh accumulation from whales
Copy link to section
$XRP, the native coin of the Ripple ecosystem, is down 2.6% in the last 24 hours and is currently trading at $1.90 per coin.
The bearish performance comes despite $XRP’s Long-Term Holder Net Unrealized Profit/Loss (LTH-NUPL) indicator resetting to levels historically associated with accumulation phases and local price floors.
According to Glassnode, the LTH-NUPL ratio indicates a transition to optimism at 0.39. If this metric continues to improve, investors would regain interest in $XRP as accumulation pushes its price higher.
LTH-NUPL serves as an indicator of long-term investor behaviour as it tracks transactions with a lifespan of at least 155 days.
In addition to that, institutional investors are increasing their exposure to $XRP.
According to CoinGlass, $XRP ETFs recorded approximately $1.07 million in inflows on Thursday, led by Franklin Templeton’s XRPZ. The cumulative total inflow currently stands at $1.23 billion, and the net assets at $1.39 billion.
However, retail interest in $XRP remains largely poor despite institutional investors increasing their exposure to the cryptocurrency.
$XRP’s Open Interest averaged $3.38 billion on Thursday, up slightly from $3.35 the previous day.
The OI has declined from $4.55 billion recorded on January 6, indicating that retail traders have reduced their exposure to the market.
The low OI could negatively affect $XRP’s price in the near term.
Will $XRP defend the $1.90 level?
Copy link to section
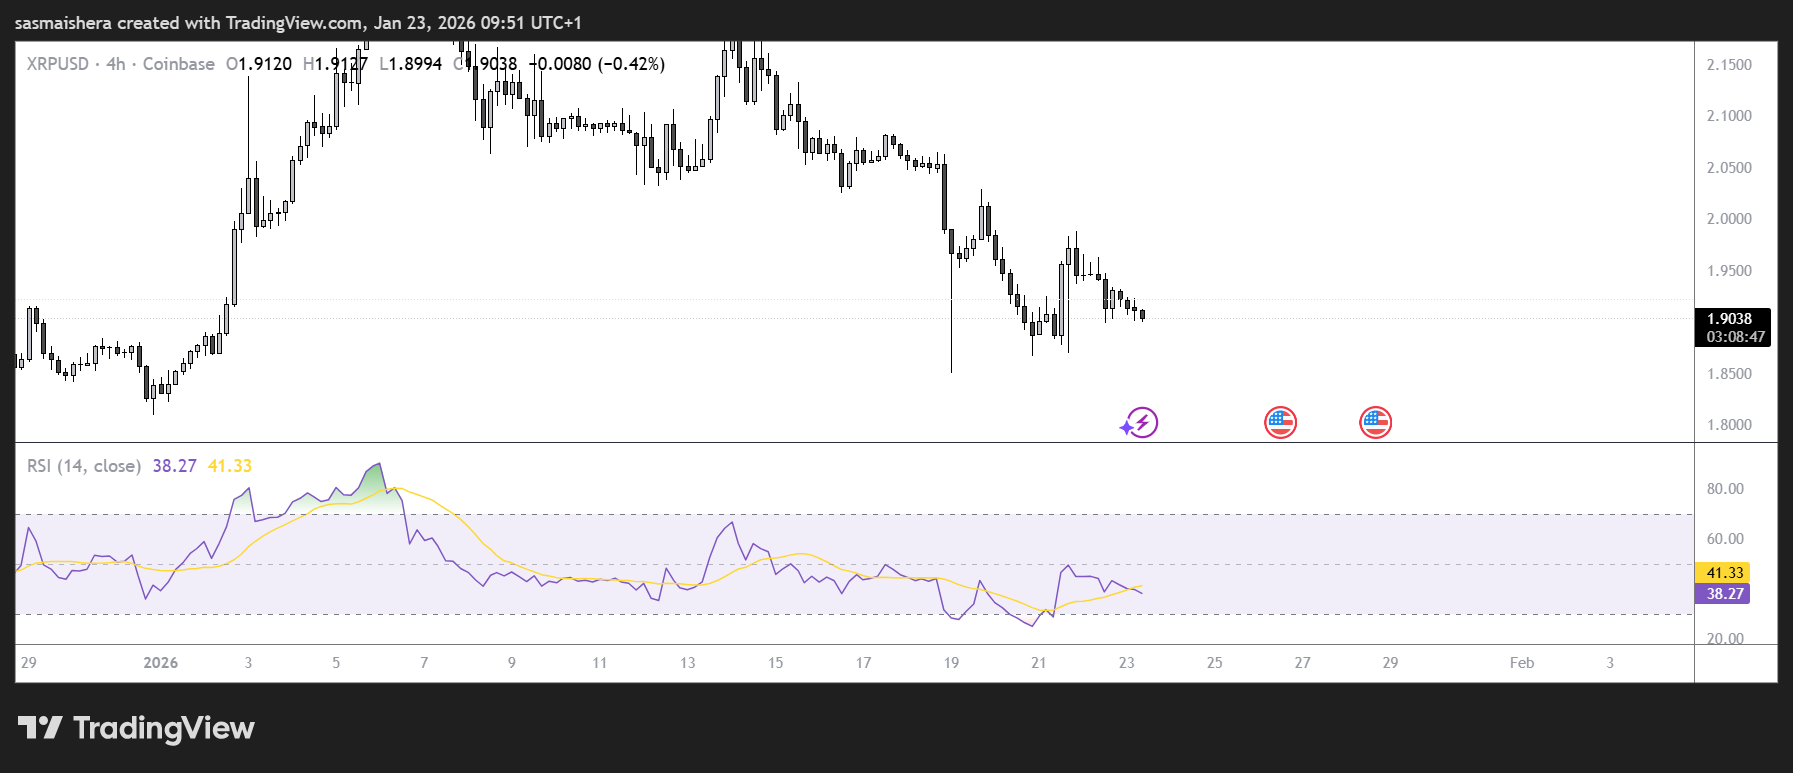
The $XRP/USD 4-hour chart is bearish as $XRP has given up its gains from earlier this year.
The technical indicators remain bearish, suggesting that sellers remain in control.
At press time, $XRP is trading at $1.906. The Moving Average Convergence Divergence (MACD) indicator remains below the signal line on the 4-hour chart, confirming $XRP’s short-term bearish momentum.
The RSI of 41 is also below the neutral 50, adding further bearish confluence to $XRP.
The $1.90 support level remains critical for $XRP, as losing it could see the coin drop toward Monday’s low of $1.85.
However, if the bulls maintain $XRP’s price above $1.90, it could sustain a bullish momentum and reclaim the $2.00 psychological threshold.
Beyond this level, the 50-day Exponential Moving Average (EMA) at $2.05, the 100-day EMA at $2.18, and the 200-day EMA at $2.30 could serve as potential resistance levels in the near to medium term.
Currently, the market conditions remain choppy, which could see its price swing between resistance and support levels.