$XRP has officially delivered its first technical golden cross of 2026, and the market is already looking at a 13% upside window if this bull pattern validates in textbook manner.
On Jan. 13, $XRP's 23-day simple moving average crossed above the 50-day, as visible on the TradingView chart, which is a golden cross formation for the first time since late 2025. For those not familiar, this bullish crossover with "golden" in its name usually indicates a bullish trend shift, especially when it is backed by rising volumes or key narrative developments.
The price is currently holding just above $2.06, but the area between $2.28 and $2.35 — where the 200-day exponential average is — remains the immediate target zone.
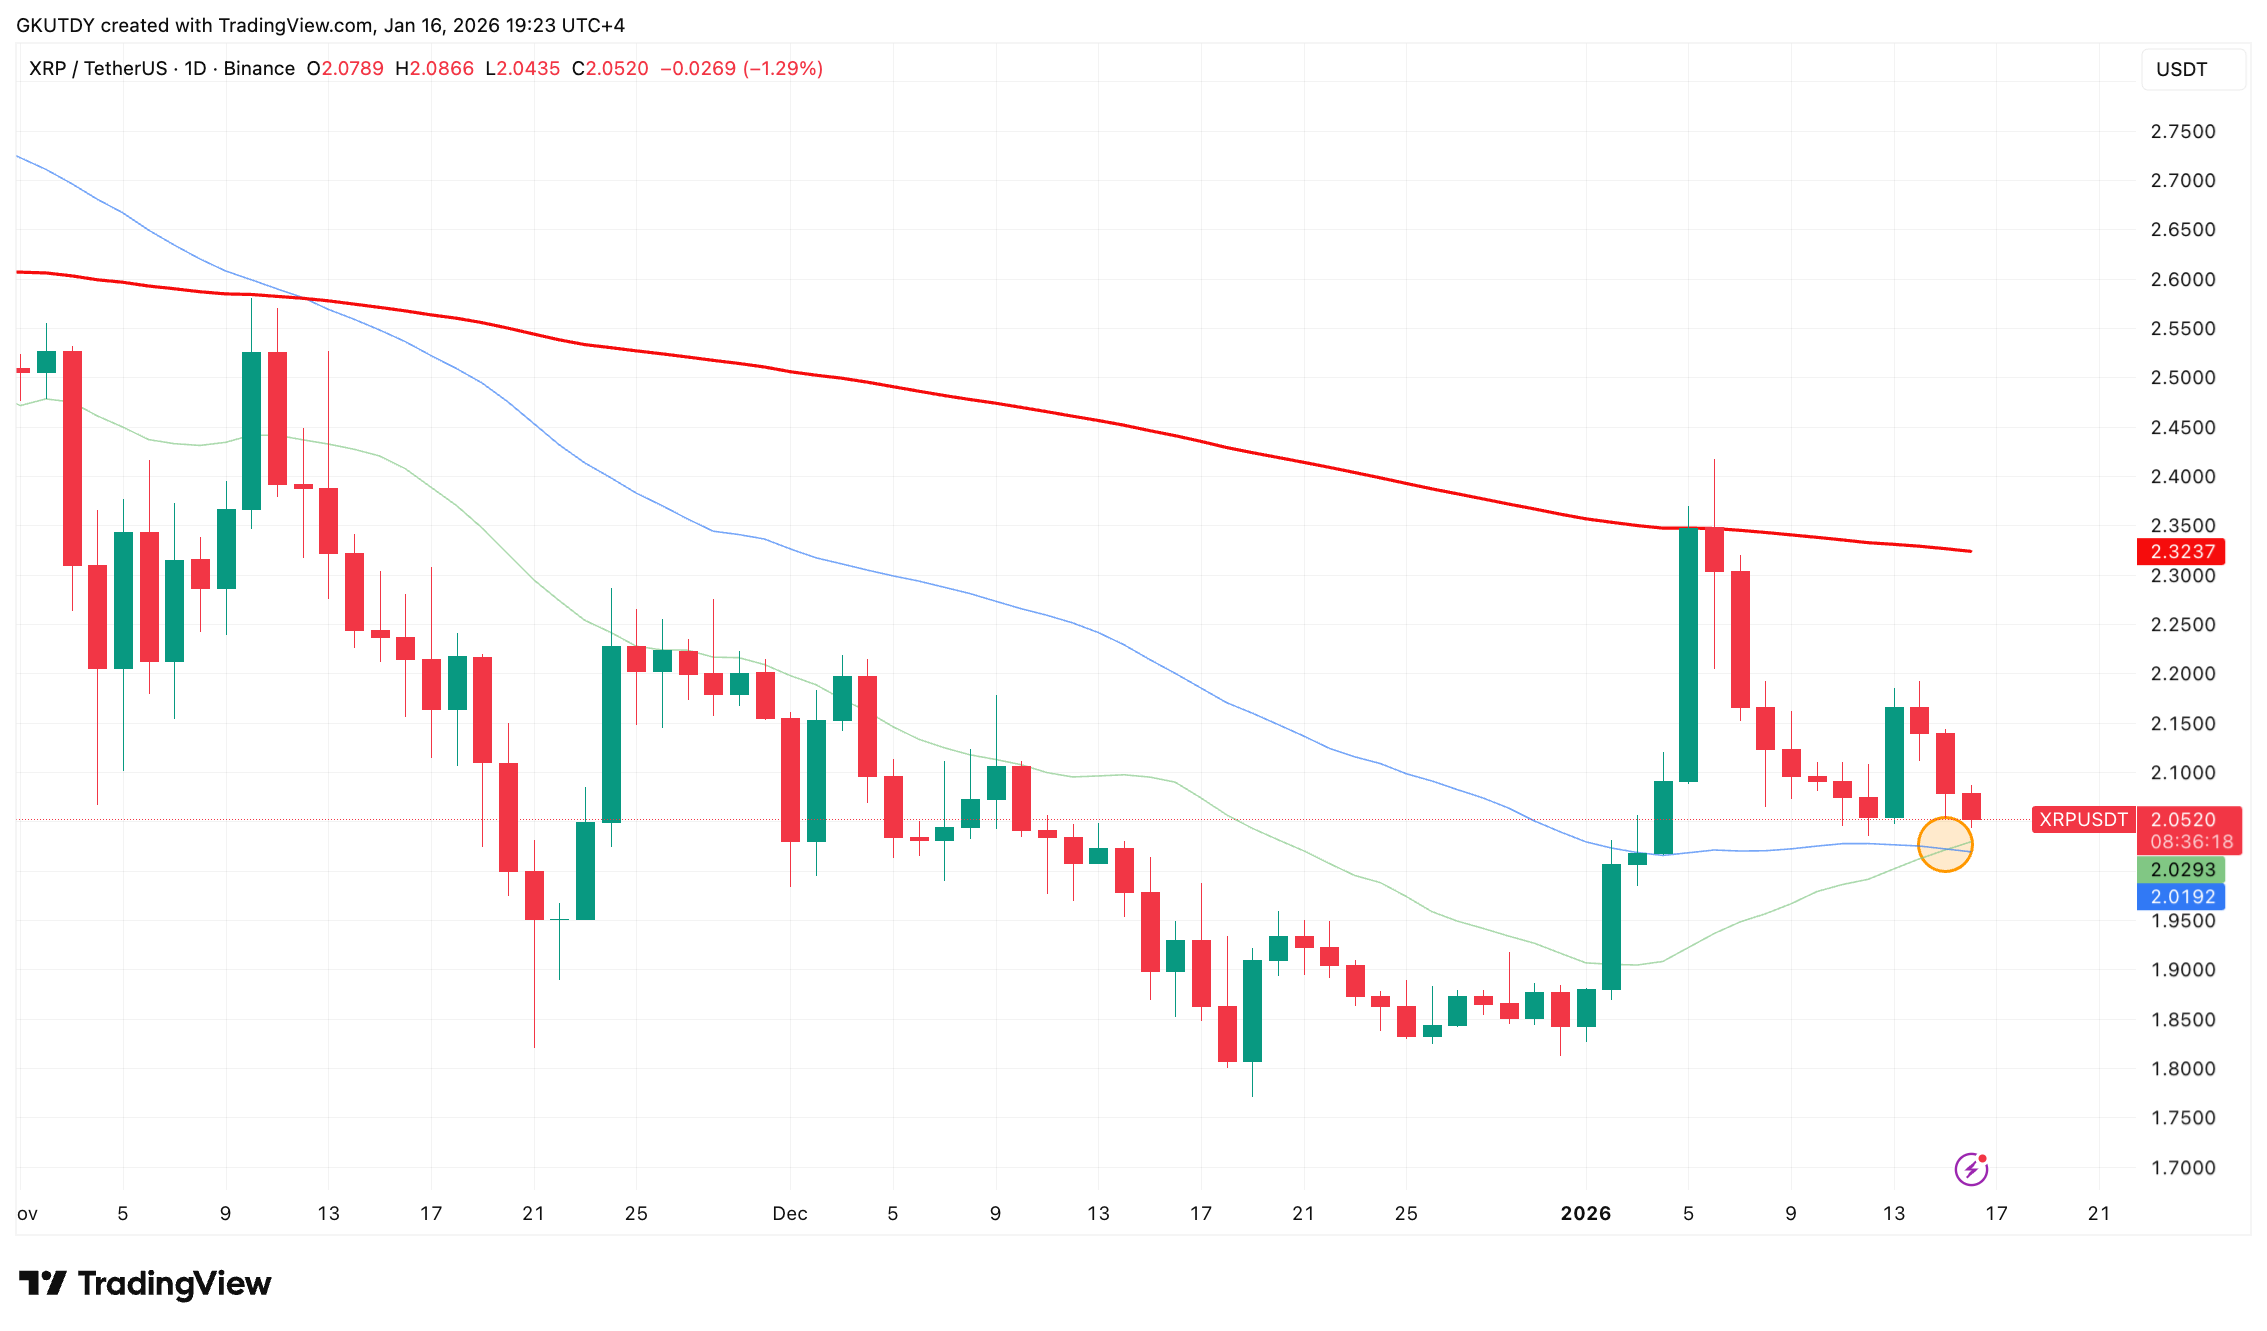
This new setup comes after $XRP's big spike to $2.40 earlier this month. Now that the short-term and midterm trend lines are all headed up, it is pretty likely that this golden cross will play out as expected, sending the price of $XRP to the north.
The technical stuff points to this happening, but only as long as $XRP stays above the $2.02-2.03 range, where the golden cross happened.
$2.7 $XRP may happen faster than market thinks
If the price indeed goes up to $2.32 from where it is now, that would be an increase worth over 13%. The last time $XRP showed the same pattern, it jumped about 22% before it hit the top. This means the $2.32 level might just be the first stop.
If you are an $XRP bull, keep a close eye on the daily close above $2.10 to build pressure to the 200 EMA ceiling. If it breaks and holds above $2.35, the next big target is $2.70 per $XRP.
Either way, the golden cross has given bulls a clear roadmap to follow for the first time in 2026.