Dogecoin ($DOGE) is trying to steady itself after a sharp selloff on the 4-hour chart, with buyers stepping in near a key demand zone. Price rebounded from the $0.136–$0.138 area and pushed back above $0.140, showing that dip buyers still defend lower levels.
However, $DOGE remains stuck inside a broader range, since it has not cleared the main resistance band near $0.142–$0.151. Traders now watch whether the recovery turns into a breakout, or fades into another rejection.
$DOGE Rebounds, But Resistance Still Caps Upside
$DOGE climbed after bouncing from $0.1362, which aligns with a major Fibonacci support level. Besides that bounce, price has started challenging moving average resistance near $0.1423. This level acts as a pivot zone and could decide whether momentum keeps improving.
Bollinger Bands also suggest the market could be preparing for another strong move. Volatility expanded during the drop, then tightened again as $DOGE recovered. Consequently, traders may see a sharper breakout attempt once price leaves this compression phase.
If bulls push above $0.1423 with strength, the next barrier sits near $0.1479. This Fibonacci resistance often attracts sellers, especially during early recovery rallies. Moreover, the upper boundary near $0.1512 remains the range ceiling and upper Bollinger Band level. A clean move above $0.1512 would open the path toward $0.1566.
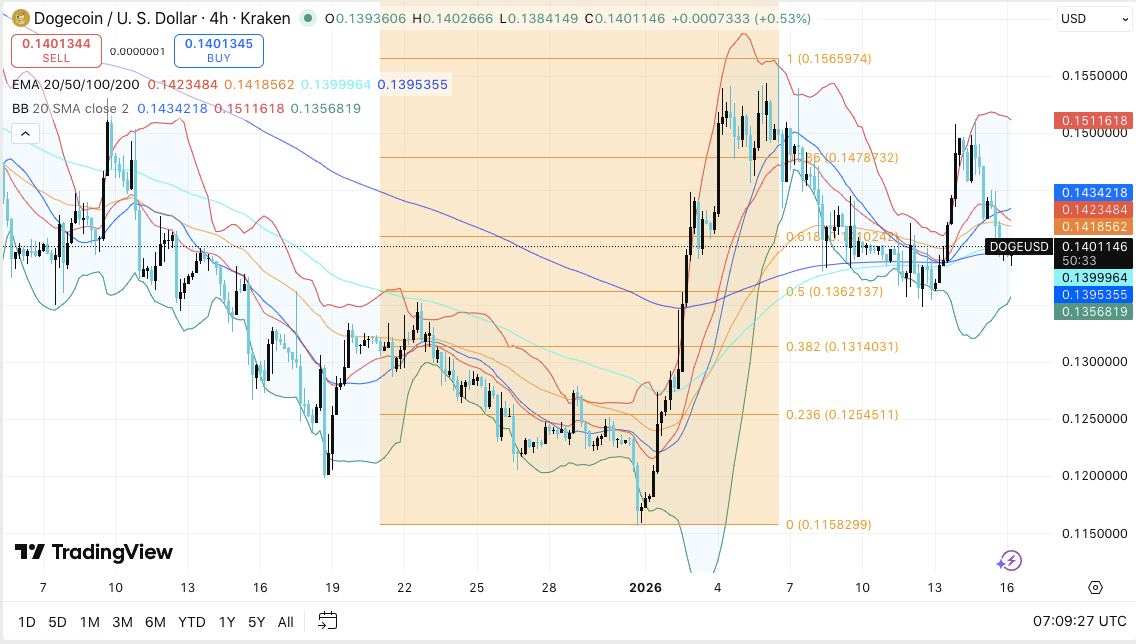
$DOGE still needs to protect $0.1401, since it acts as the current holding area. Additionally, the $0.1395–$0.1400 zone offers moving average support, which helps maintain the rebound structure.
If price slips below $0.140, the focus shifts back to $0.1362. Buyers previously defended this zone, so another test could attract demand again. However, a breakdown below $0.1314 would weaken the structure further. Hence, $0.1254 becomes the next key downside area. A larger bearish continuation would become clearer below $0.1158, which marks a major swing low.
Derivatives and Spot Flows Show Cautious Sentiment
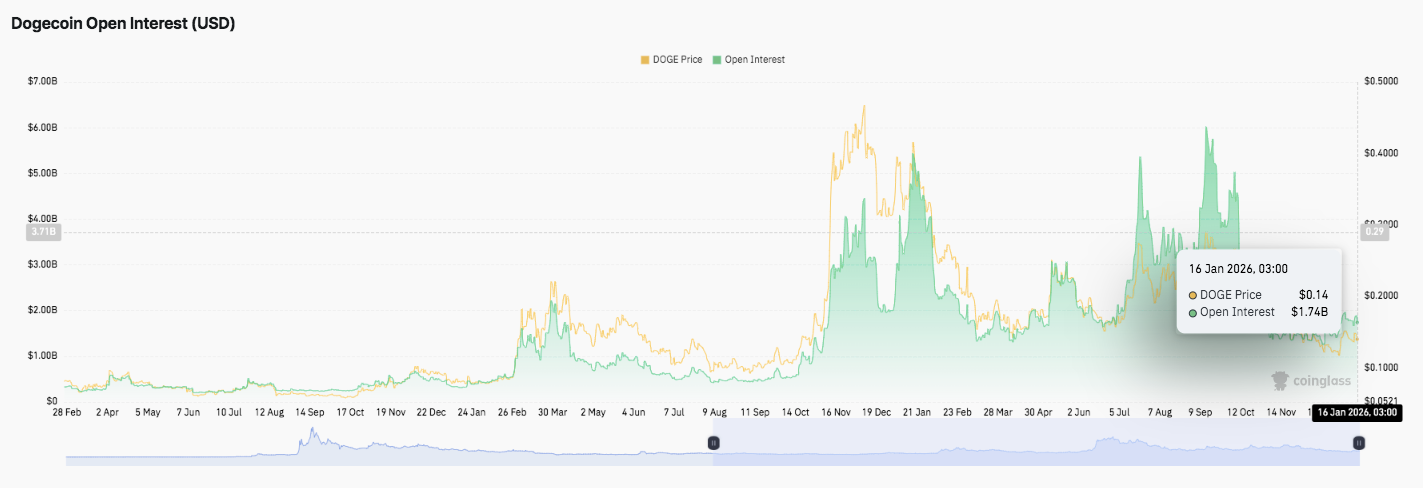
$DOGE open interest reflects a boom-and-bust cycle tied to past price swings. Open interest surged during the late-year rally, then fell sharply as leverage positions closed. Significantly, open interest has stabilized near $1.74 billion as $DOGE trades around $0.14. This level suggests traders are rebuilding exposure without aggressive risk.
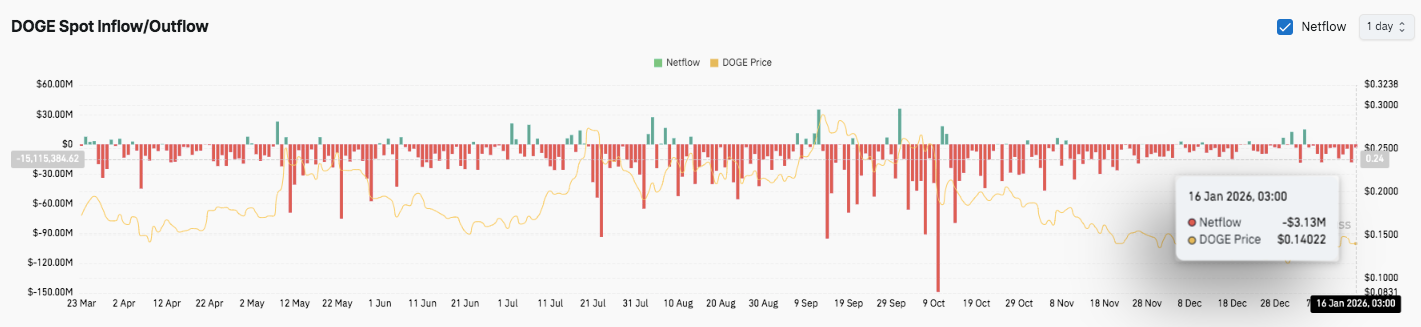
Spot flow data also leans bearish, with net outflows remaining the dominant trend. Although inflow bursts appear at times, they fade quickly. The latest reading shows a netflow near $3.13 million, which signals mild outflows as $DOGE consolidates.
Technical Outlook for Dogecoin Price
Key levels remain well-defined on the 4-hour chart as $DOGE attempts to stabilize after a sharp pullback. Upside levels sit at $0.1423, $0.1479, and $0.1512 as the next major hurdles. A clean breakout above this resistance band could extend the recovery toward $0.1566, which marks the next local top target.
On the downside, $0.1401 acts as the immediate support zone. A loss of this level could weaken the rebound and expose $DOGE to the $0.1395–$0.1400 EMA support cluster.
Below that, bulls must defend $0.1362, which has already triggered a strong bounce. Failure to hold this level risks reopening downside targets at $0.1314 and $0.1254, with $0.1158 standing as the larger swing low.
The technical picture suggests $DOGE is compressing after earlier volatility expansion on the Bollinger Bands. This setup often precedes a sharp breakout in either direction.
Will Dogecoin Go Up?
$DOGE price prediction hinges on whether buyers can hold $0.140 and flip $0.1423 into support. If momentum strengthens, $DOGE could challenge $0.1479–$0.1512 and push toward $0.1566.
However, repeated rejection in the $0.142–$0.148 band could trigger another rotation back toward $0.136. For now, $DOGE remains in a pivotal zone, and the next breakout will likely define the next trend leg.
Disclaimer: The information presented in this article is for informational and educational purposes only. The article does not constitute financial advice or advice of any kind. Coin Edition is not responsible for any losses incurred as a result of the utilization of content, products, or services mentioned. Readers are advised to exercise caution before taking any action related to the company.