The cryptocurrency market is bullish in the last 24 hours, with Bitcoin hitting the $98k level while Ether and other major coins are in the green.
However, $HYPE, the native coin of the Hyperliquid DEX, has dropped below $25 after losing 3% of its value in the last 24 hours.
Its bearish performance comes as $HYPE fails to rebound despite improved on-chain metrics and growing derivatives market activity.
Hyperliquid’s DeFi growth could push prices higher
Copy link to section
$HYPE is trading below $25 after losing 3% of its value. However, the coin could recover soon amid improved on-chain data.
Hyperliquid’s staking activity increased by nearly 6% to reach $1.37 billion on Wednesday, suggesting that long-term holders have confidence in the project.
The increase in staking also affected the Total Value Locked (TVL) in the network’s Decentralized Finance (DeFi) ecosystem. The TVL had declined to $1.3 billion as of Tuesday, down from a record high of $2.79 billion on September 19.
This isn’t a surprise as investors lock their holdings in smart contracts when they intend to hold a token for the long term.
This increases the staking balance on the network, which often has a bullish effect on prices, as the available supply in the open market decreases.
In addition to the growing staking balance, the Hyperliquid derivatives market reflects investors’ optimism for a price recovery.
According to CoinGlass, the futures Open Interest (OI) has dropped to $1.3 billion from $1.41 billion recorded on Wednesday.
The decline in OI over the last 24 hours suggests that the retail demand has cooled down despite the broader cryptocurrency market’s rally.
$HYPE poised for a breakout despite recent pullback
Copy link to section
The $HYPE/USD 4-hour chart is bullish and efficient, with the market shift suggesting that the price could soar higher in the near term.
At press time, $HYPE is trading at $24.95, down 3% in the last 24 hours. The technical indicators suggest that $HYPE could rally higher over the next few hours or days.
The Relative Strength Index (RSI) of 55 is above the neutral 50, indicating that the pair has switched bullish in recent days.
The Moving Average Convergence Divergence (MACD) indicator on the 4-hour chart is also close to crossing the neutral zone, suggesting traders should lean into risk.
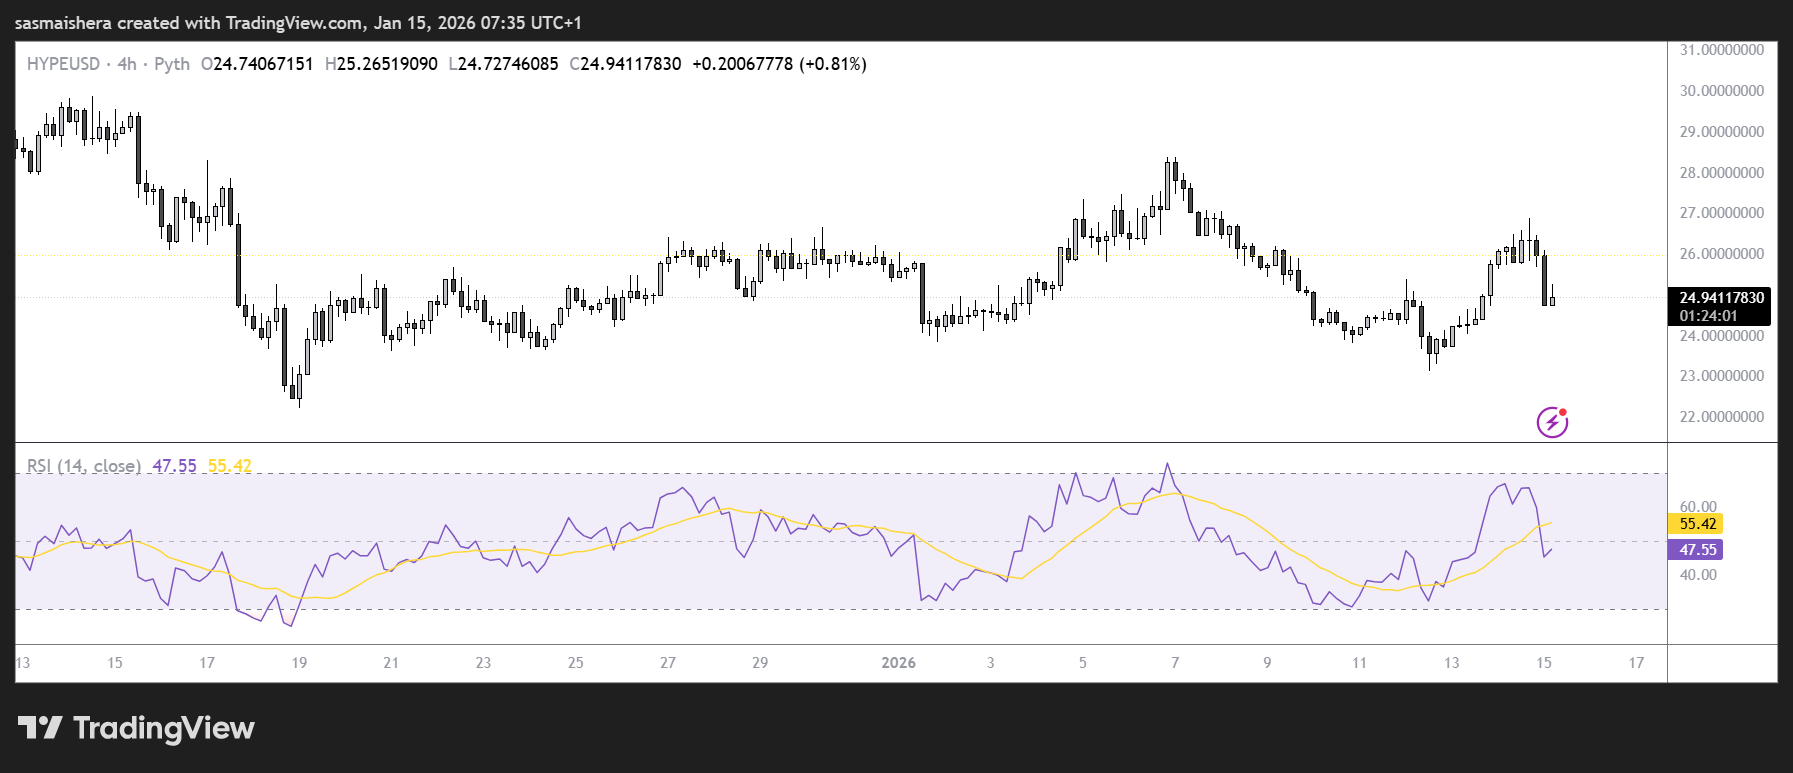
If the bullish trend resumes, $HYPE could regain momentum and break out above the 50-day Exponential Moving Average (EMA) at $28.22.
An extended bullish run would bring other resistance levels into focus, with the 100-day EMA at $32.13 and the 200-day EMA at $33.25 close targets.
A daily candle close above the $28.22 moving average could allow $HYPE to rally higher.
However, if the bearish trend continues, $HYPE could retest the Monday low and resistance level at $23.