$XRP has printed a bearish candlestick pattern on the weekly time frame, which has historically preceded significant price corrections.
Notably, prominent market analyst Ali Martinez drew the crypto community’s attention to this development in a January 10 tweet. At the time, $XRP was close to forming a gravestone doji on the weekly chart following a strong price rejection.
Importantly, this bearish pattern has fully formed following a close at $2.072 last week. The timeframe of occurrence and the technical indication this candlestick suggests have sparked concern among $XRP holders.
Gravestone Doji Puts $XRP at Risk of Further Decline
$XRP started last week on a bullish note, building on its 12% growth two weeks ago. The XRPL native token rallied nearly 13% in two days to a high of $2.41 on January 6 before the momentum faded.
Consequently, the asset has retraced 14% over five days, relinquishing all its earlier gains, and closed last week with a slight 0.88% decline. With this downtrend, $XRP formed a deadly candlestick pattern, known as the gravestone doji.
For the uninitiated, the gravestone doji is a candlestick that has an inverse “T” shape. Typically, it has a long wick, showing severe price rejection. Additionally, its opening, closing, and low price are closely clustered after a swing high, indicating that bears stepped in during the uptrend and quickly pushed the coin below its opening price.
Last week, $XRP did exactly this, dropping from its $2.41 high to its opening price of $2.09, then closing at $2.073. According to Martinez, this does not look good for $XRP, suggesting it might fall much further.
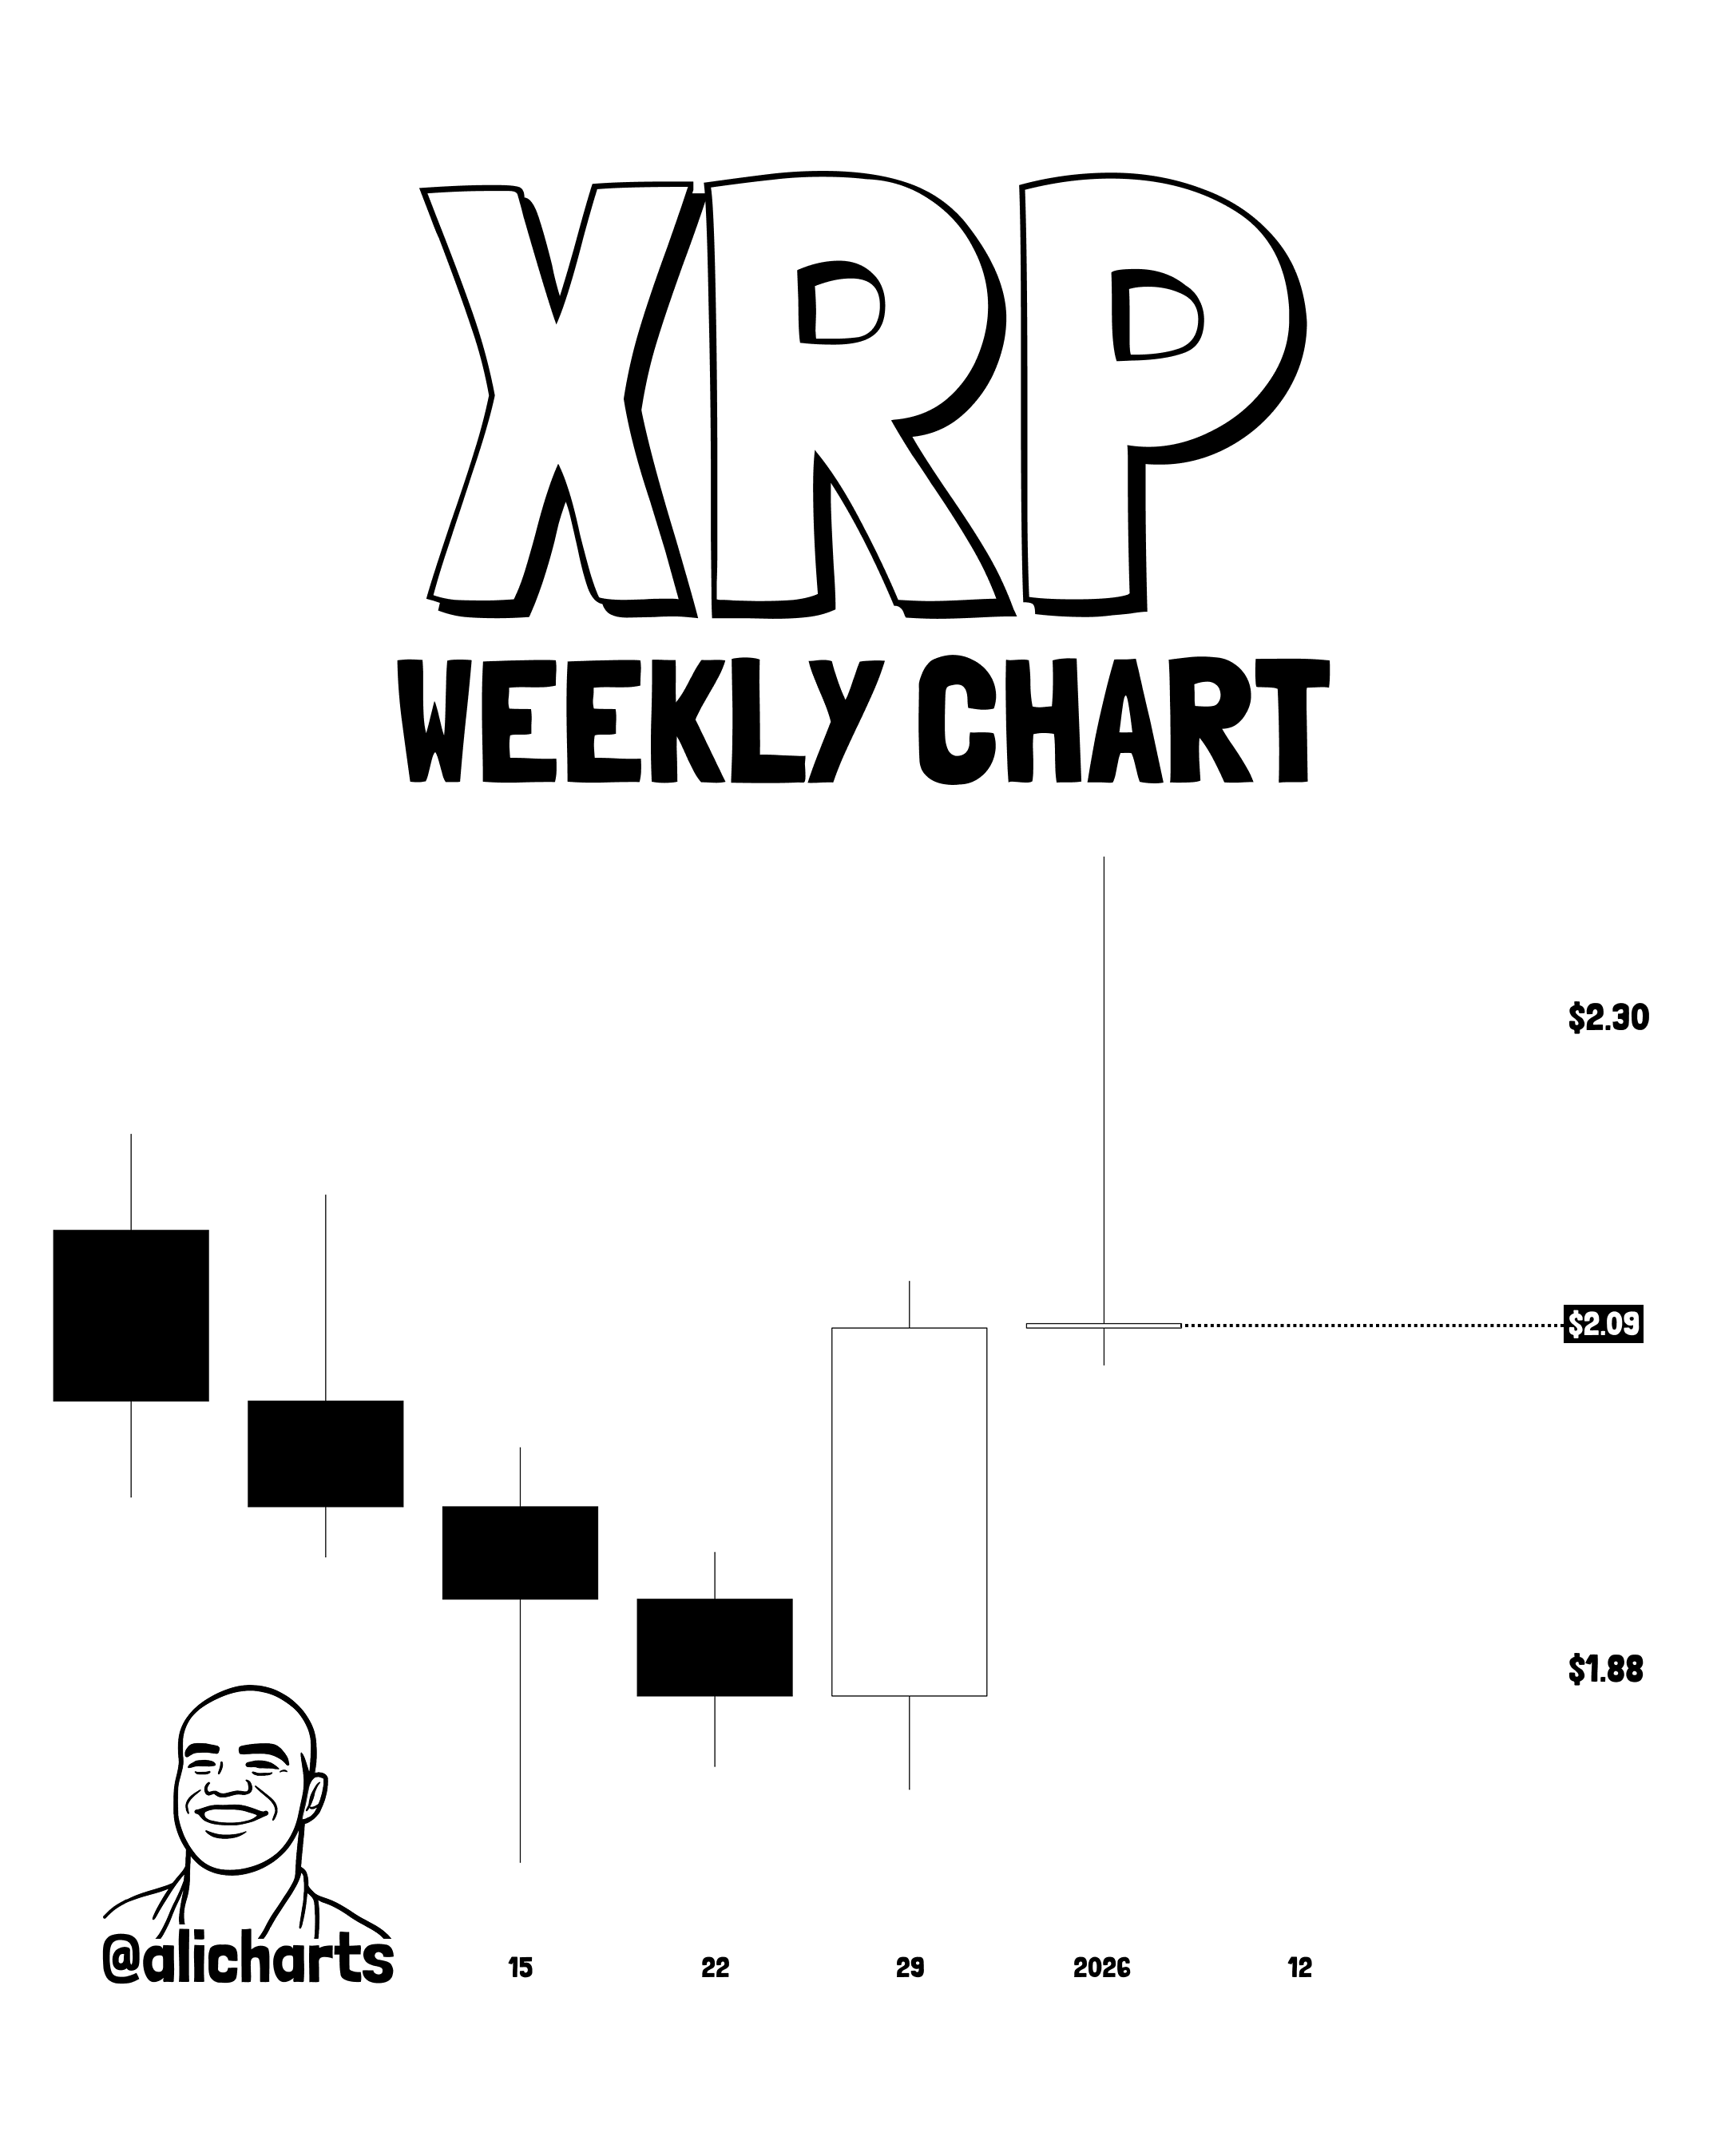 $XRP Doji Formation on Weekly Chart/Ali Martinez">
Remarkably, this aligns with several other analyses, including one from CRYPTO CAPTAIN. He noted that $XRP could drop to $1.8 after failing to hold the support around $2.10 and $2.05.
A Credible Bearish Signal?
Notably, the gravestone doji typically signals a price ceiling and the start of a larger bearish trend. Its occurrence on the higher time frame also adds to the strength, and $XRP seems to be following that trend already, with today’s 1.20% correction to $2.043.
However, some analysts argue that candlesticks and trendlines are not credible indicators of a price trend in isolation. Their reliability increases when used with other technical indicators, such as MACD and RSI.
Moreover, analyst BigBlueNation views the $XRP retracement differently. In response to Martinez, he noted that the downtrend was merely a retest before a broader bullish development.
I think what you’re seeing is the handle shakeout ridding weak hands. $XRP broke the handle of that weekly cup for the first time since Oct 9. We know what happened on the 10th. We broke it again a few days ago and now are holding on re test. You do see however on the 4hr an… pic.twitter.com/5KgVww5tAz
— BigBlueNation (@BigBlueNation85) January 10, 2026
His chart shows that $XRP broke out of a descending channel last week, and the ongoing retracement was just to shake off weak hands and retest the structure before the next impulsive move.