$XRP just triggered a golden cross on the monthly chart by TradingView against the leading cryptocurrency, Bitcoin ($BTC), for the first time since early 2017, with its 23-month simple moving average crossing above the 50-month line after nearly six years of compression and underperformance.
The last time this exact signal appeared, which was over eight years ago, $XRP rallied from 0.0000179 $BTC to 0.0001740 $BTC in less than 120 days, surging nearly 9x higher and even overtaking Ethereum.
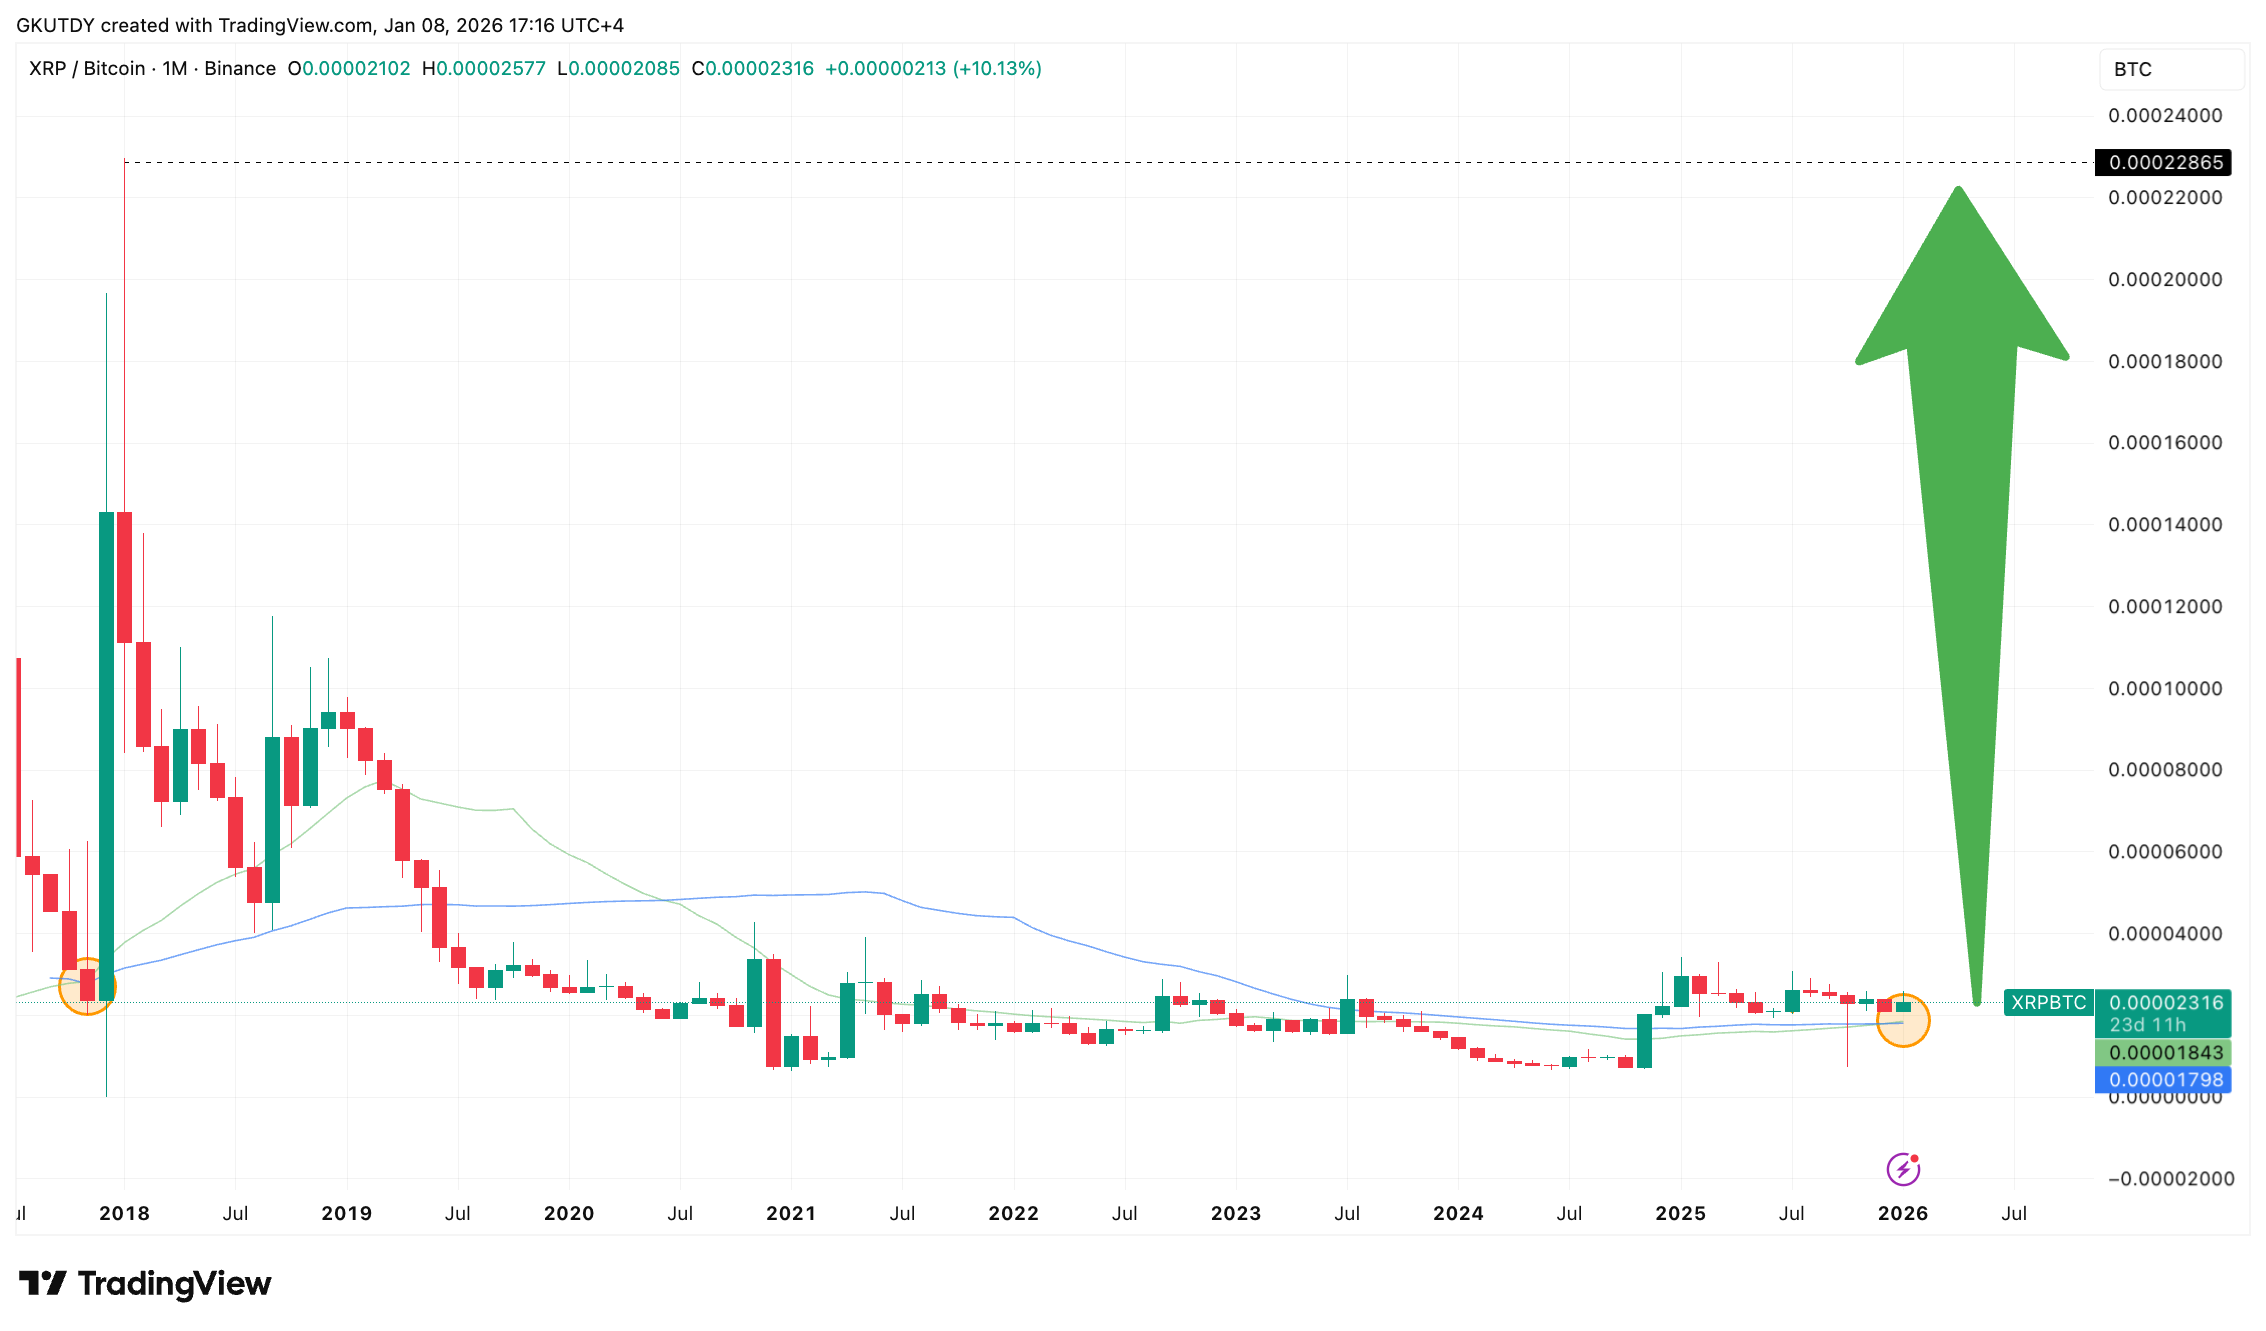
This new golden cross comes off a great base as $XRP/$BTC has held key support between 0.00001798 and 0.00001843 against Bitcoin for over four months. It printed a bullish engulfing candle in December and opened January with a 9.7% breakout above both long-term moving averages.
Unlike the failed upside wicks of 2021, this setup is forming below resistance, with trend lines curling upward and a textbook compression breakout forming inside a long-term range.
$XRP to $17 among targets
Technically, there is open air up to 0.00003 per $BTC for $XRP, and then to 0.00006 $BTC level, both of which are major resistance levels from the 2019-2021 cycle.
If the price regains these zones and repeats even a fraction of the 2017 path, the 875% upside scenario will be more than just nostalgia. It would become a measurable risk-on trade, which Bitcoin pairs have not offered in years.
A return to the 2017 $XRP/$BTC peak of 0.0001740, paired with a Bitcoin price ranging from $86,000 to $100,000, would put the price of $XRP in dollar terms between $14.96 and $17.40. Reclaiming the 0.00006 zone would put $XRP in the $5.16-$6.00 range, which is nearly triple its current level of $2.07.