
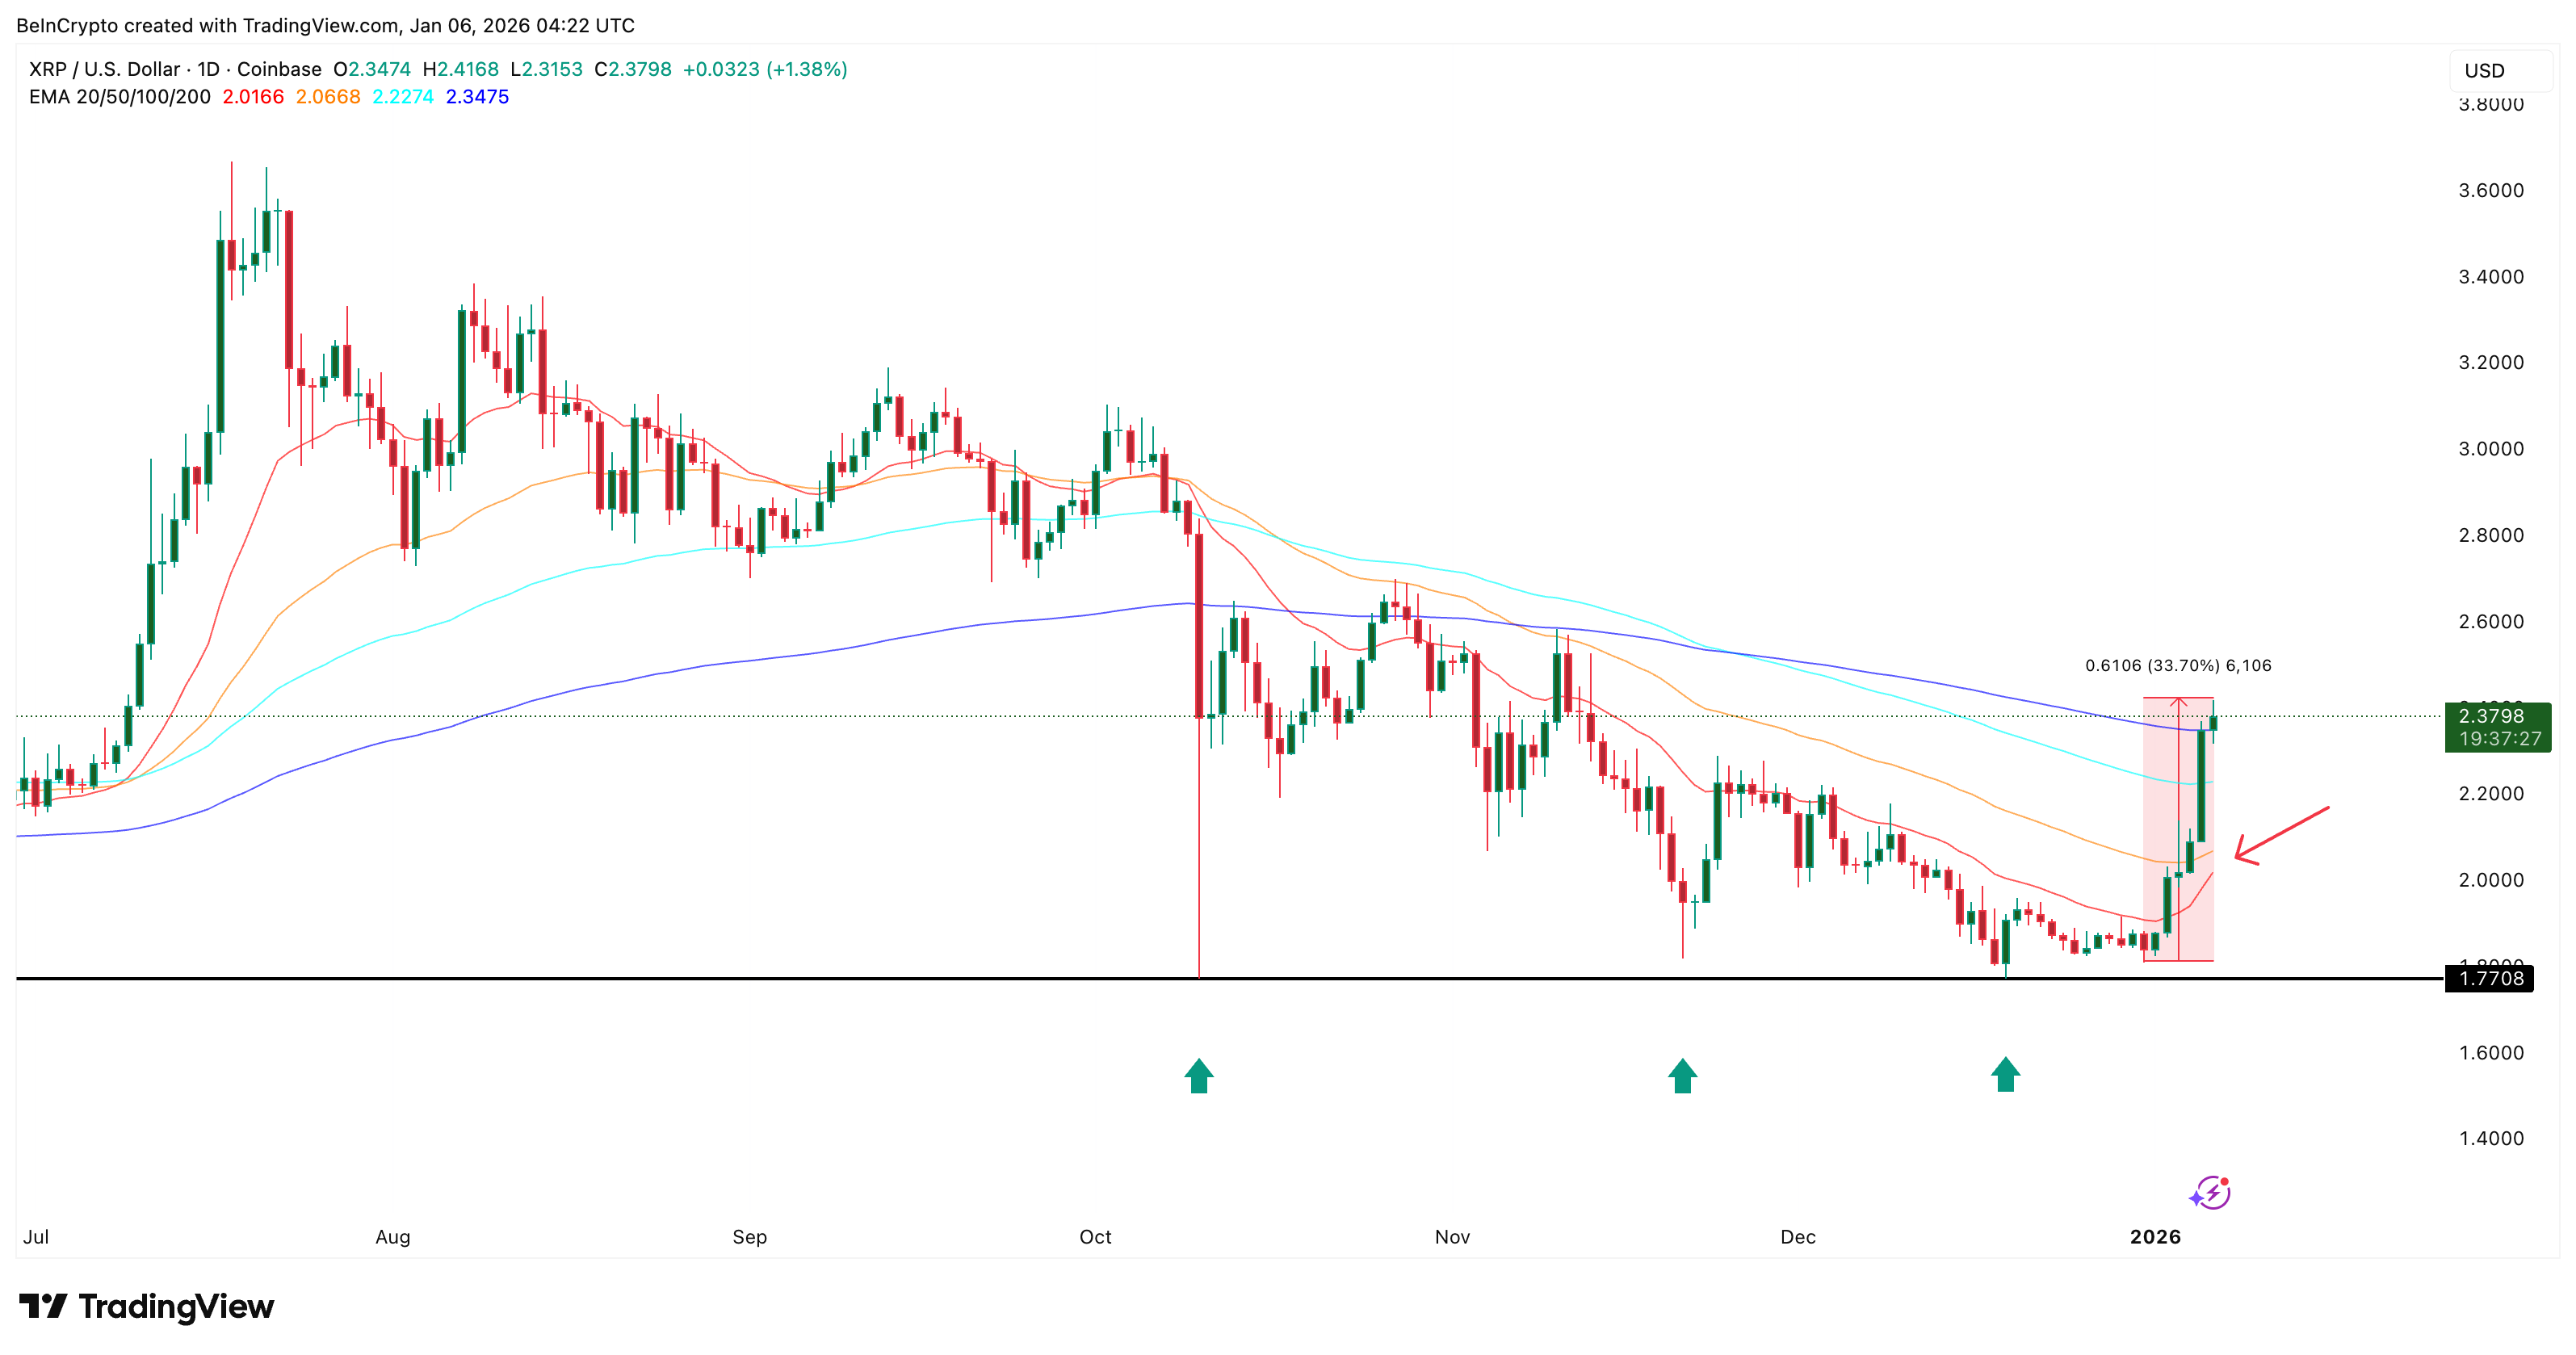
$XRP price has surged nearly 33% from its December 31 lows and is up about 11% over the past 24 hours. The move marks one of $XRP’s strongest short-term rebounds in months and comes after a prolonged consolidation phase.
The rally has improved the broader $XRP price prediction, but confirmation is still incomplete. Technical momentum is strengthening, yet on-chain signals show the market entering a sensitive profit zone. Whether $XRP can extend higher now depends on how the price behaves around one critical resistance area.
Price Prediction Strengthens as Crossover and Volume Signals Meet; But…
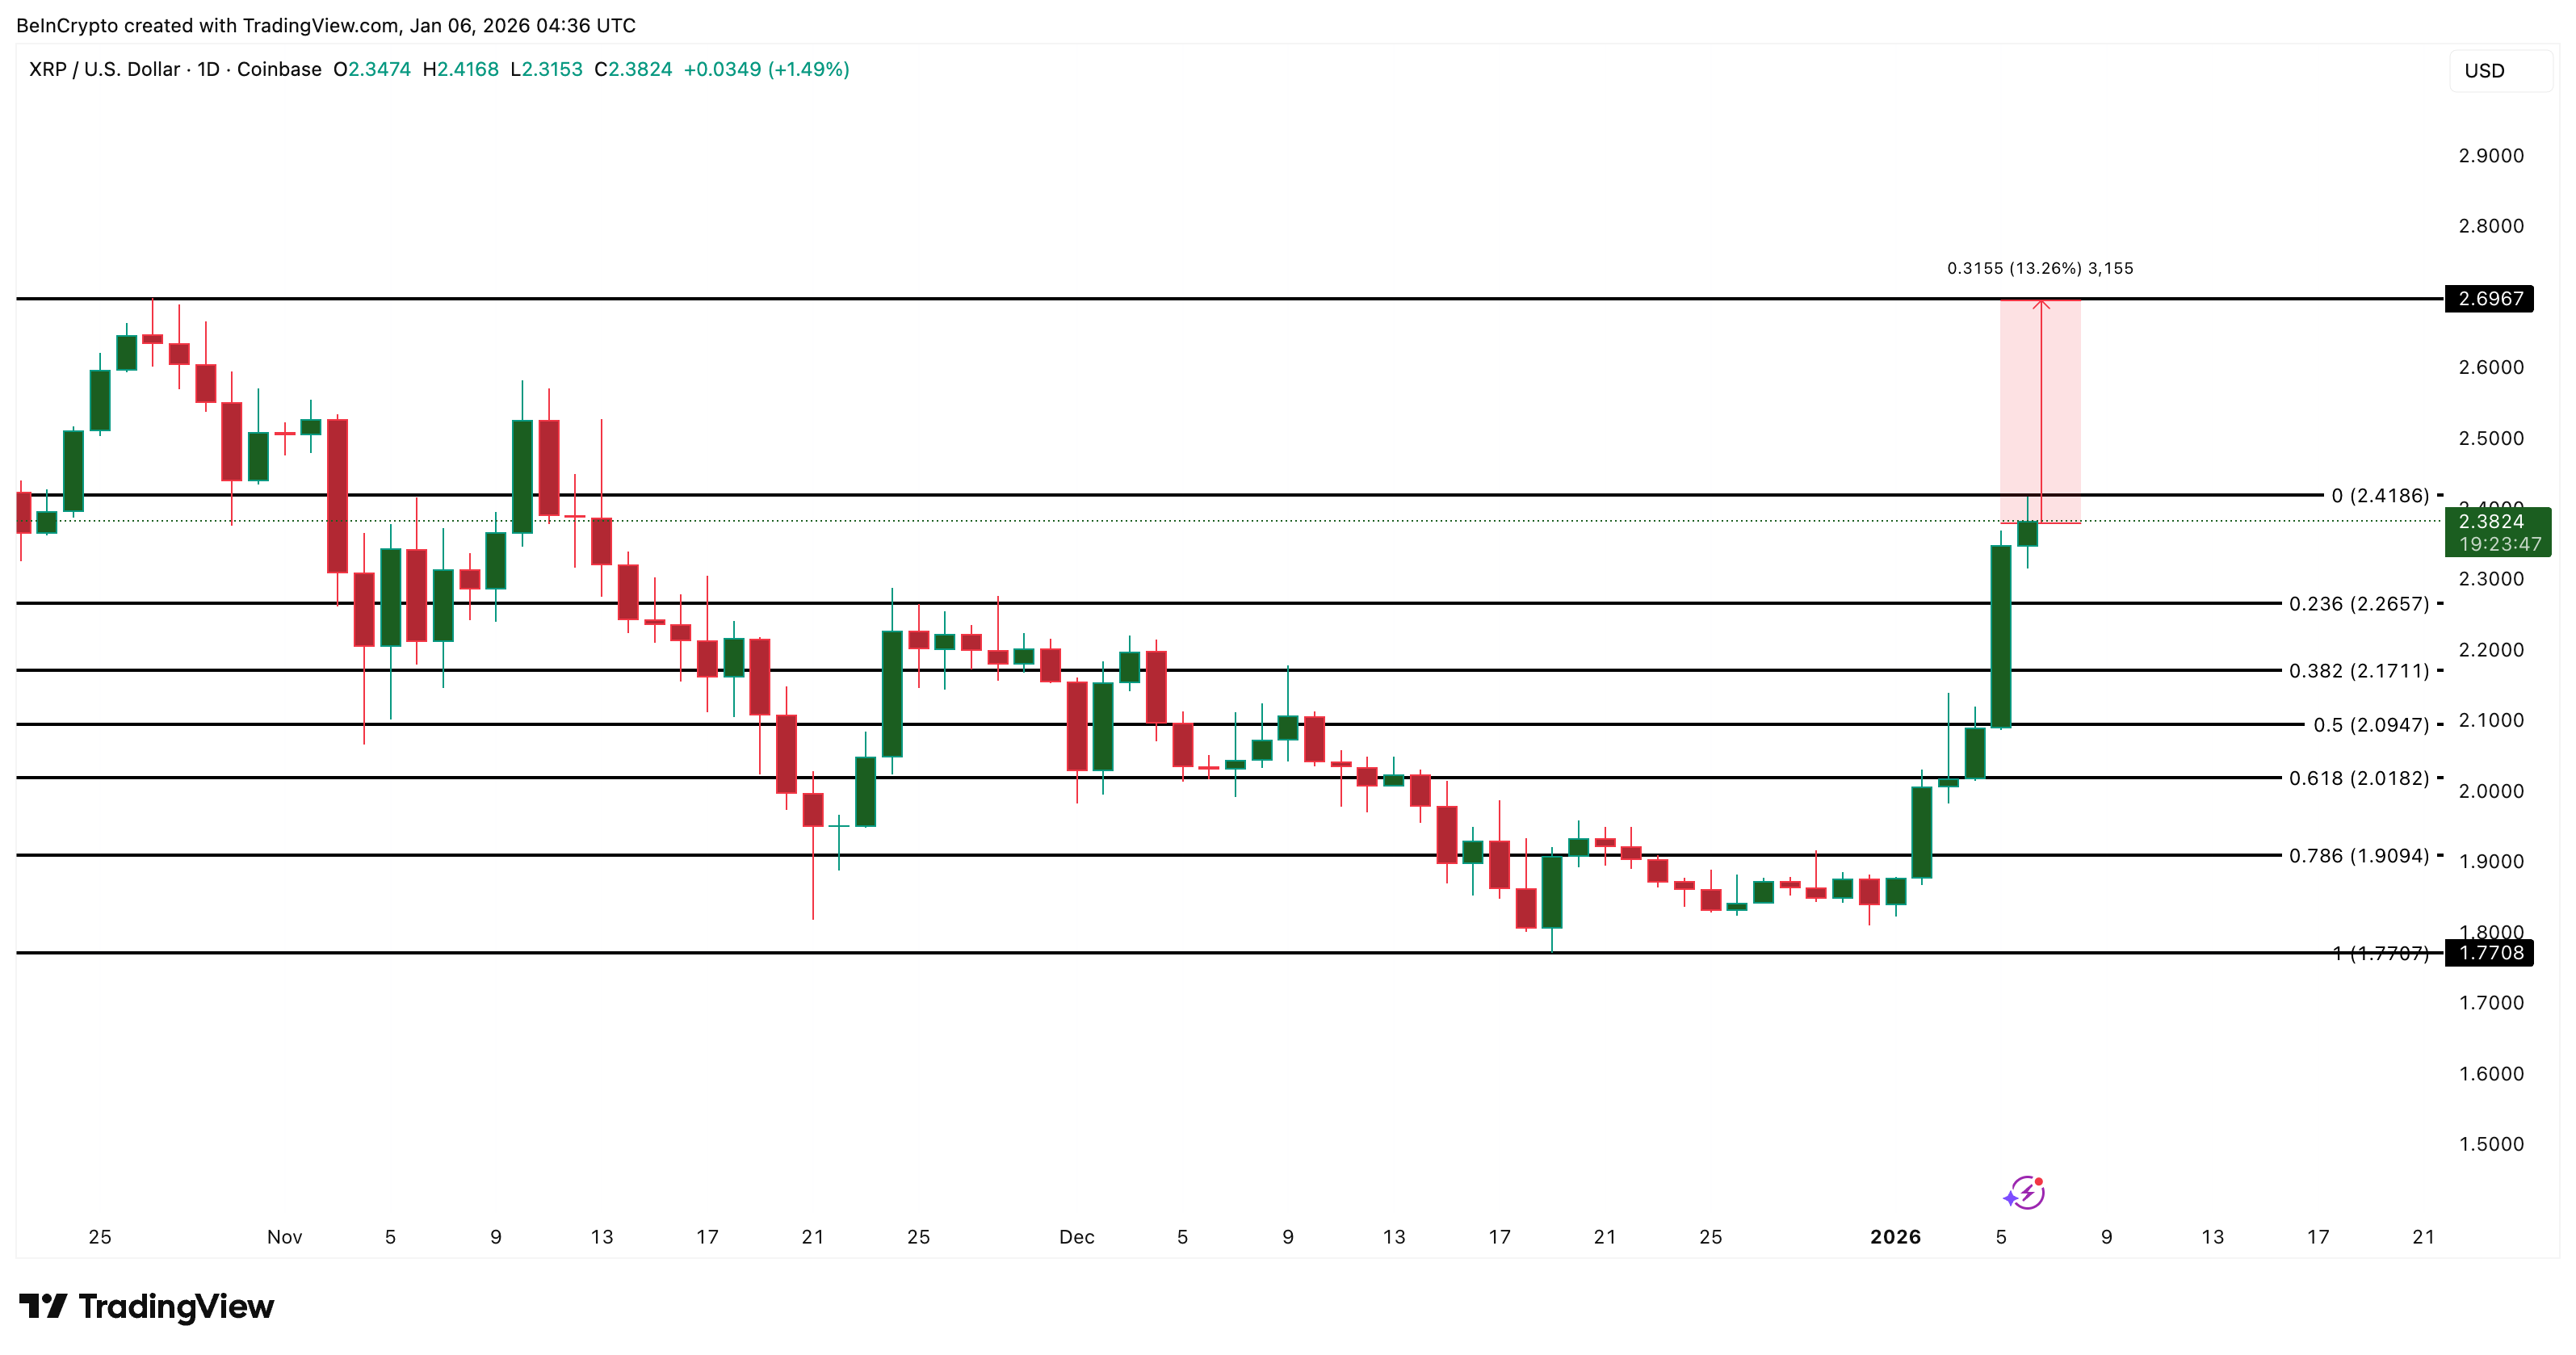
$XRP’s rebound began after forming a triple bottom near the $1.77 level. This zone acted as support multiple times and now serves as the structural base of the rally.
Momentum indicators are turning supportive. The 20-day exponential moving average is closing in on the 50-day EMA. An EMA gives more weight to recent prices, so when a faster EMA moves above a slower one, it often signals a shift toward bullish momentum. A confirmed bullish crossover would historically support trend continuation rather than short-lived bounces.
Want more token insights like this? Sign up for Editor Harsh Notariya’s Daily Crypto Newsletter here.
Volume behavior supports this view, but cautiously. On-balance volume, which tracks whether volume flows into or out of an asset, has broken above a descending trendline. This suggests buyers are participating in the breakout. However, OBV has not yet made a clear high despite the $XRP price trending higher, showing that buying pressure is improving, but not accelerating aggressively.
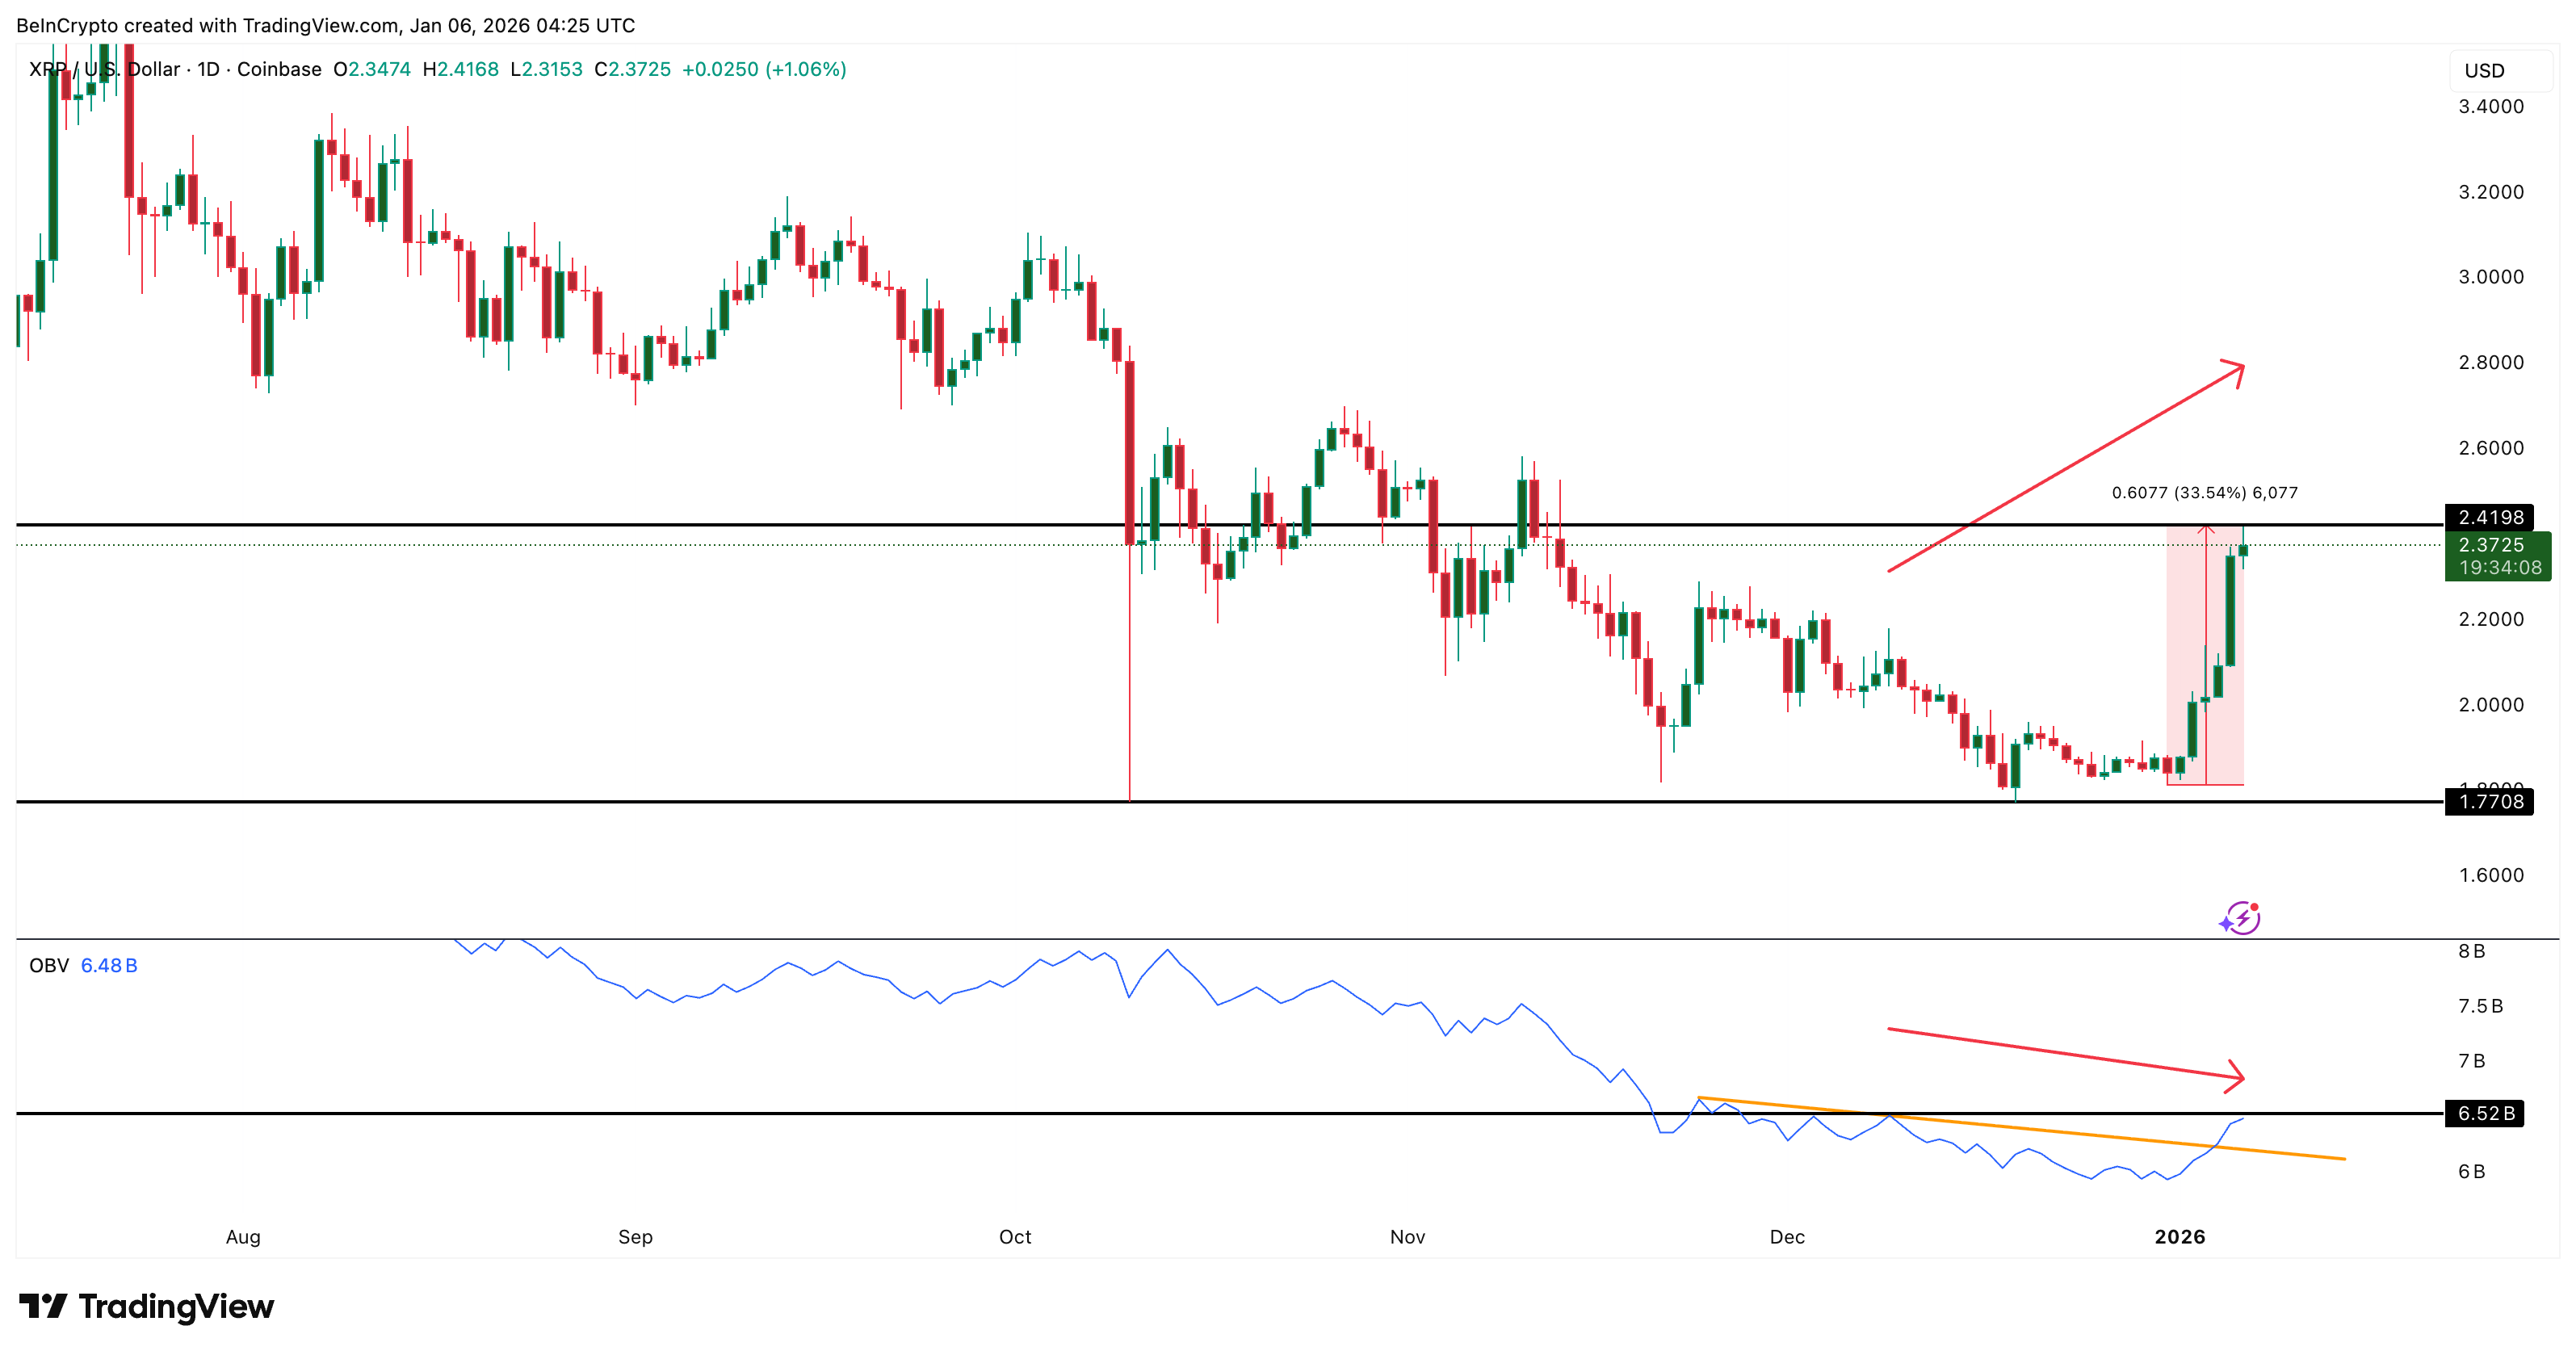
Also, the OBV rise has slowed down a bit near the $2.41 zone, as highlighted on the chart. The long candle wick also shows that sellers might be returning at this level.
Together, these signals improve the $XRP price prediction, but they still require price confirmation at higher levels.
On-Chain Data Shows Accumulation, but Profit Pressure Is Rising
On-chain data adds nuance to the setup.
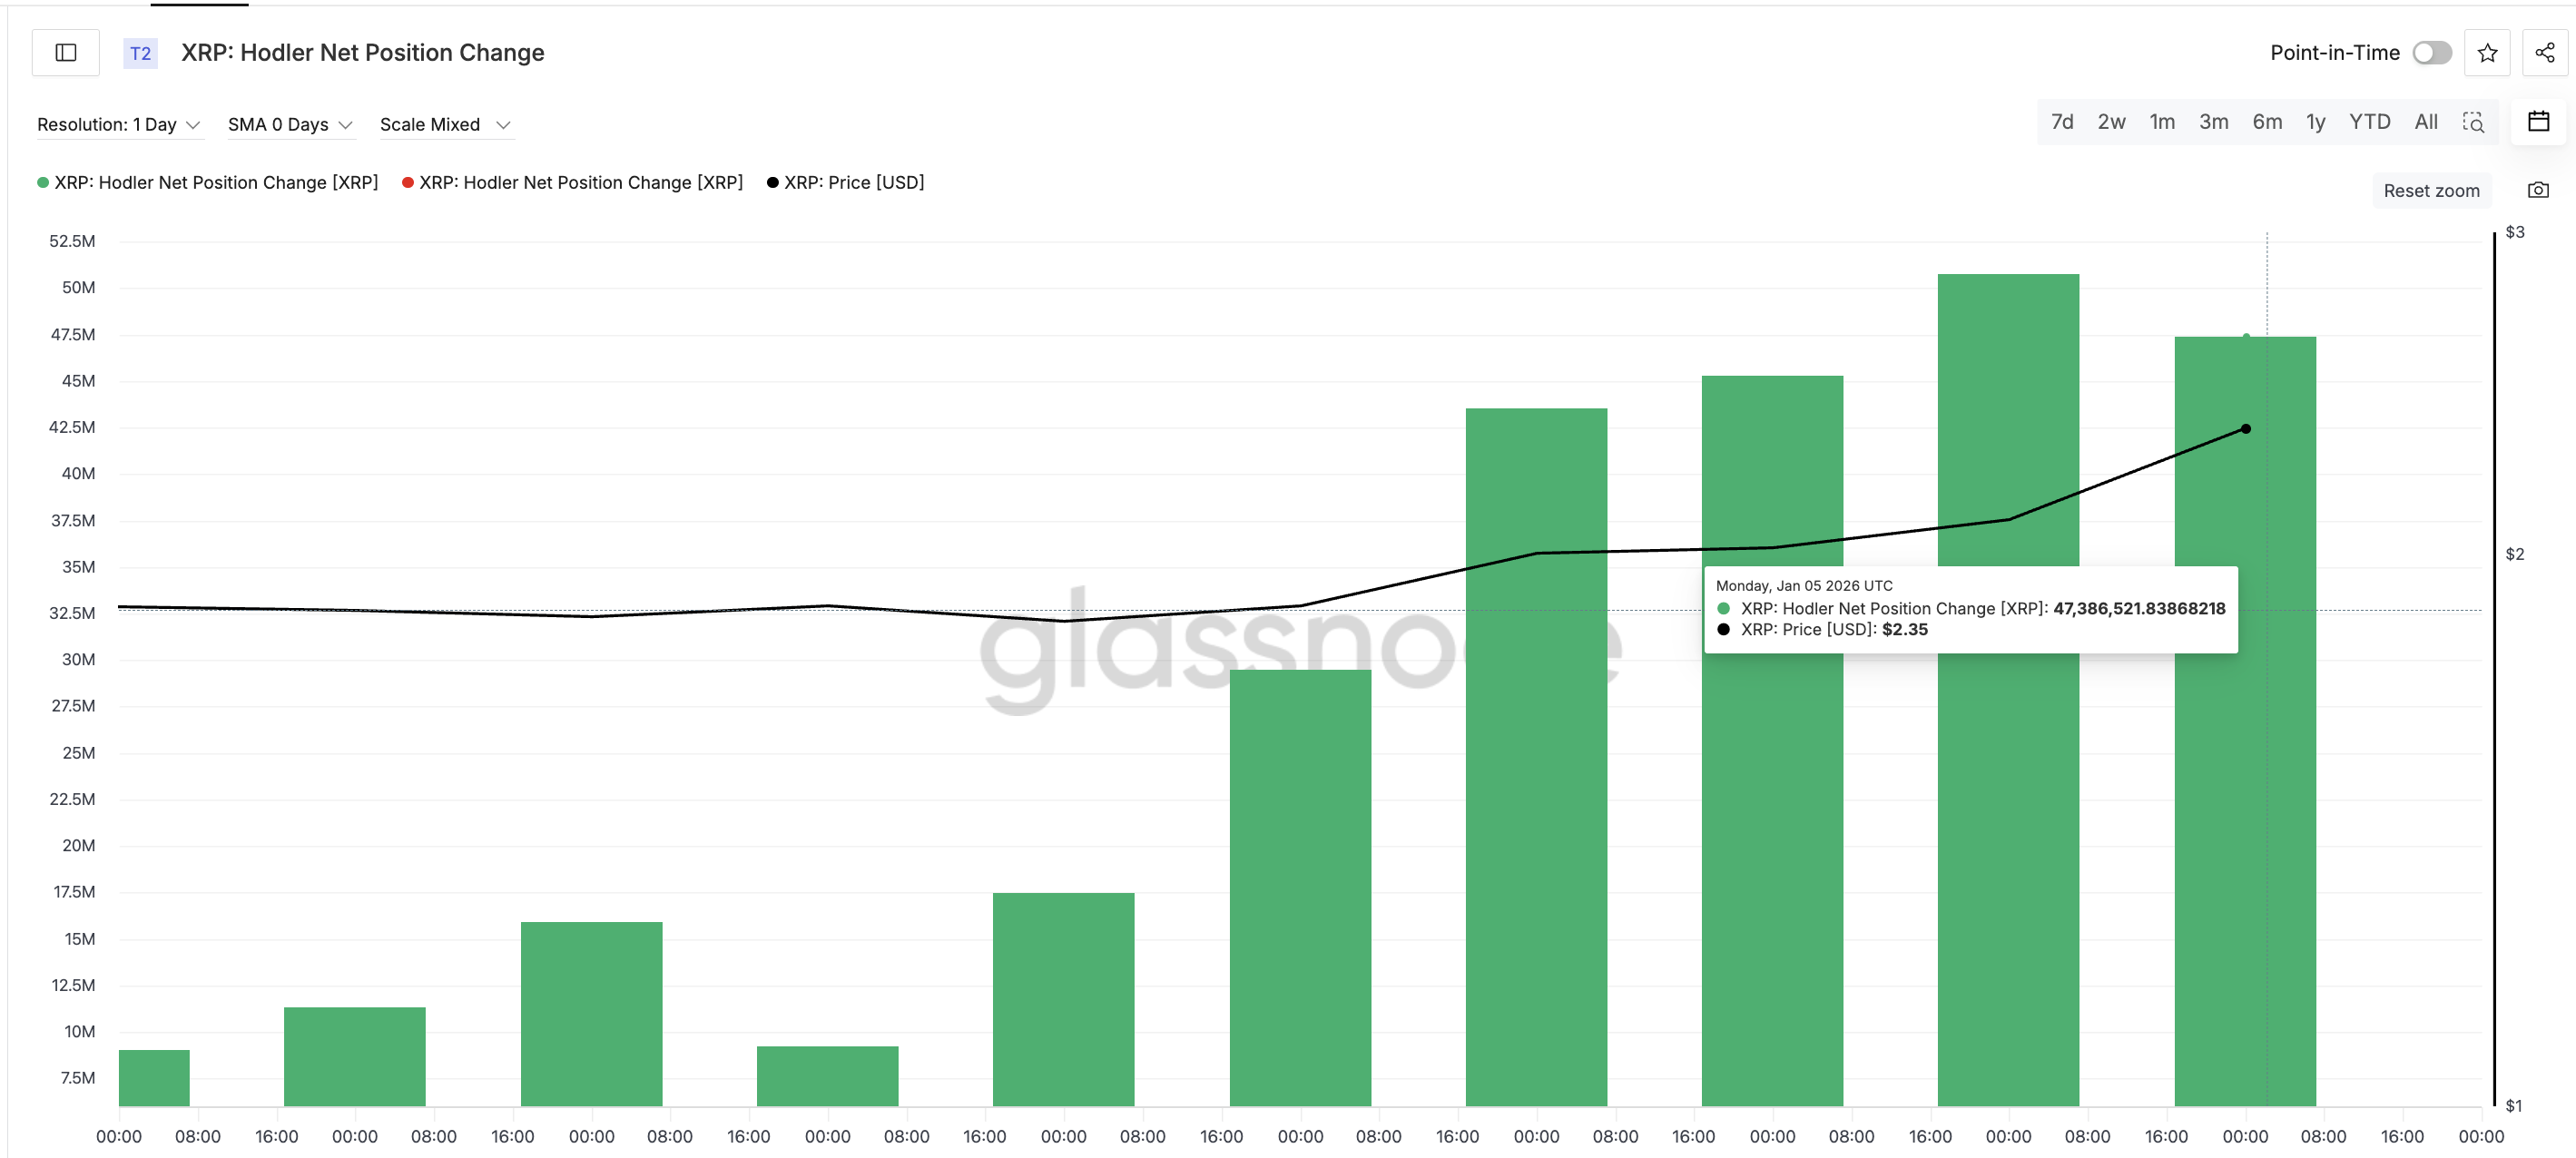
Long-term holders are still accumulating. Long-term holders are wallets that have held $XRP for extended periods and historically sell less frequently. Since December 30, this group has increased its net holdings from roughly 9 million $XRP each day to about 47 million $XRP. That represents an increase of over 420% in net accumulation during the rally phase, confirming ongoing conviction.
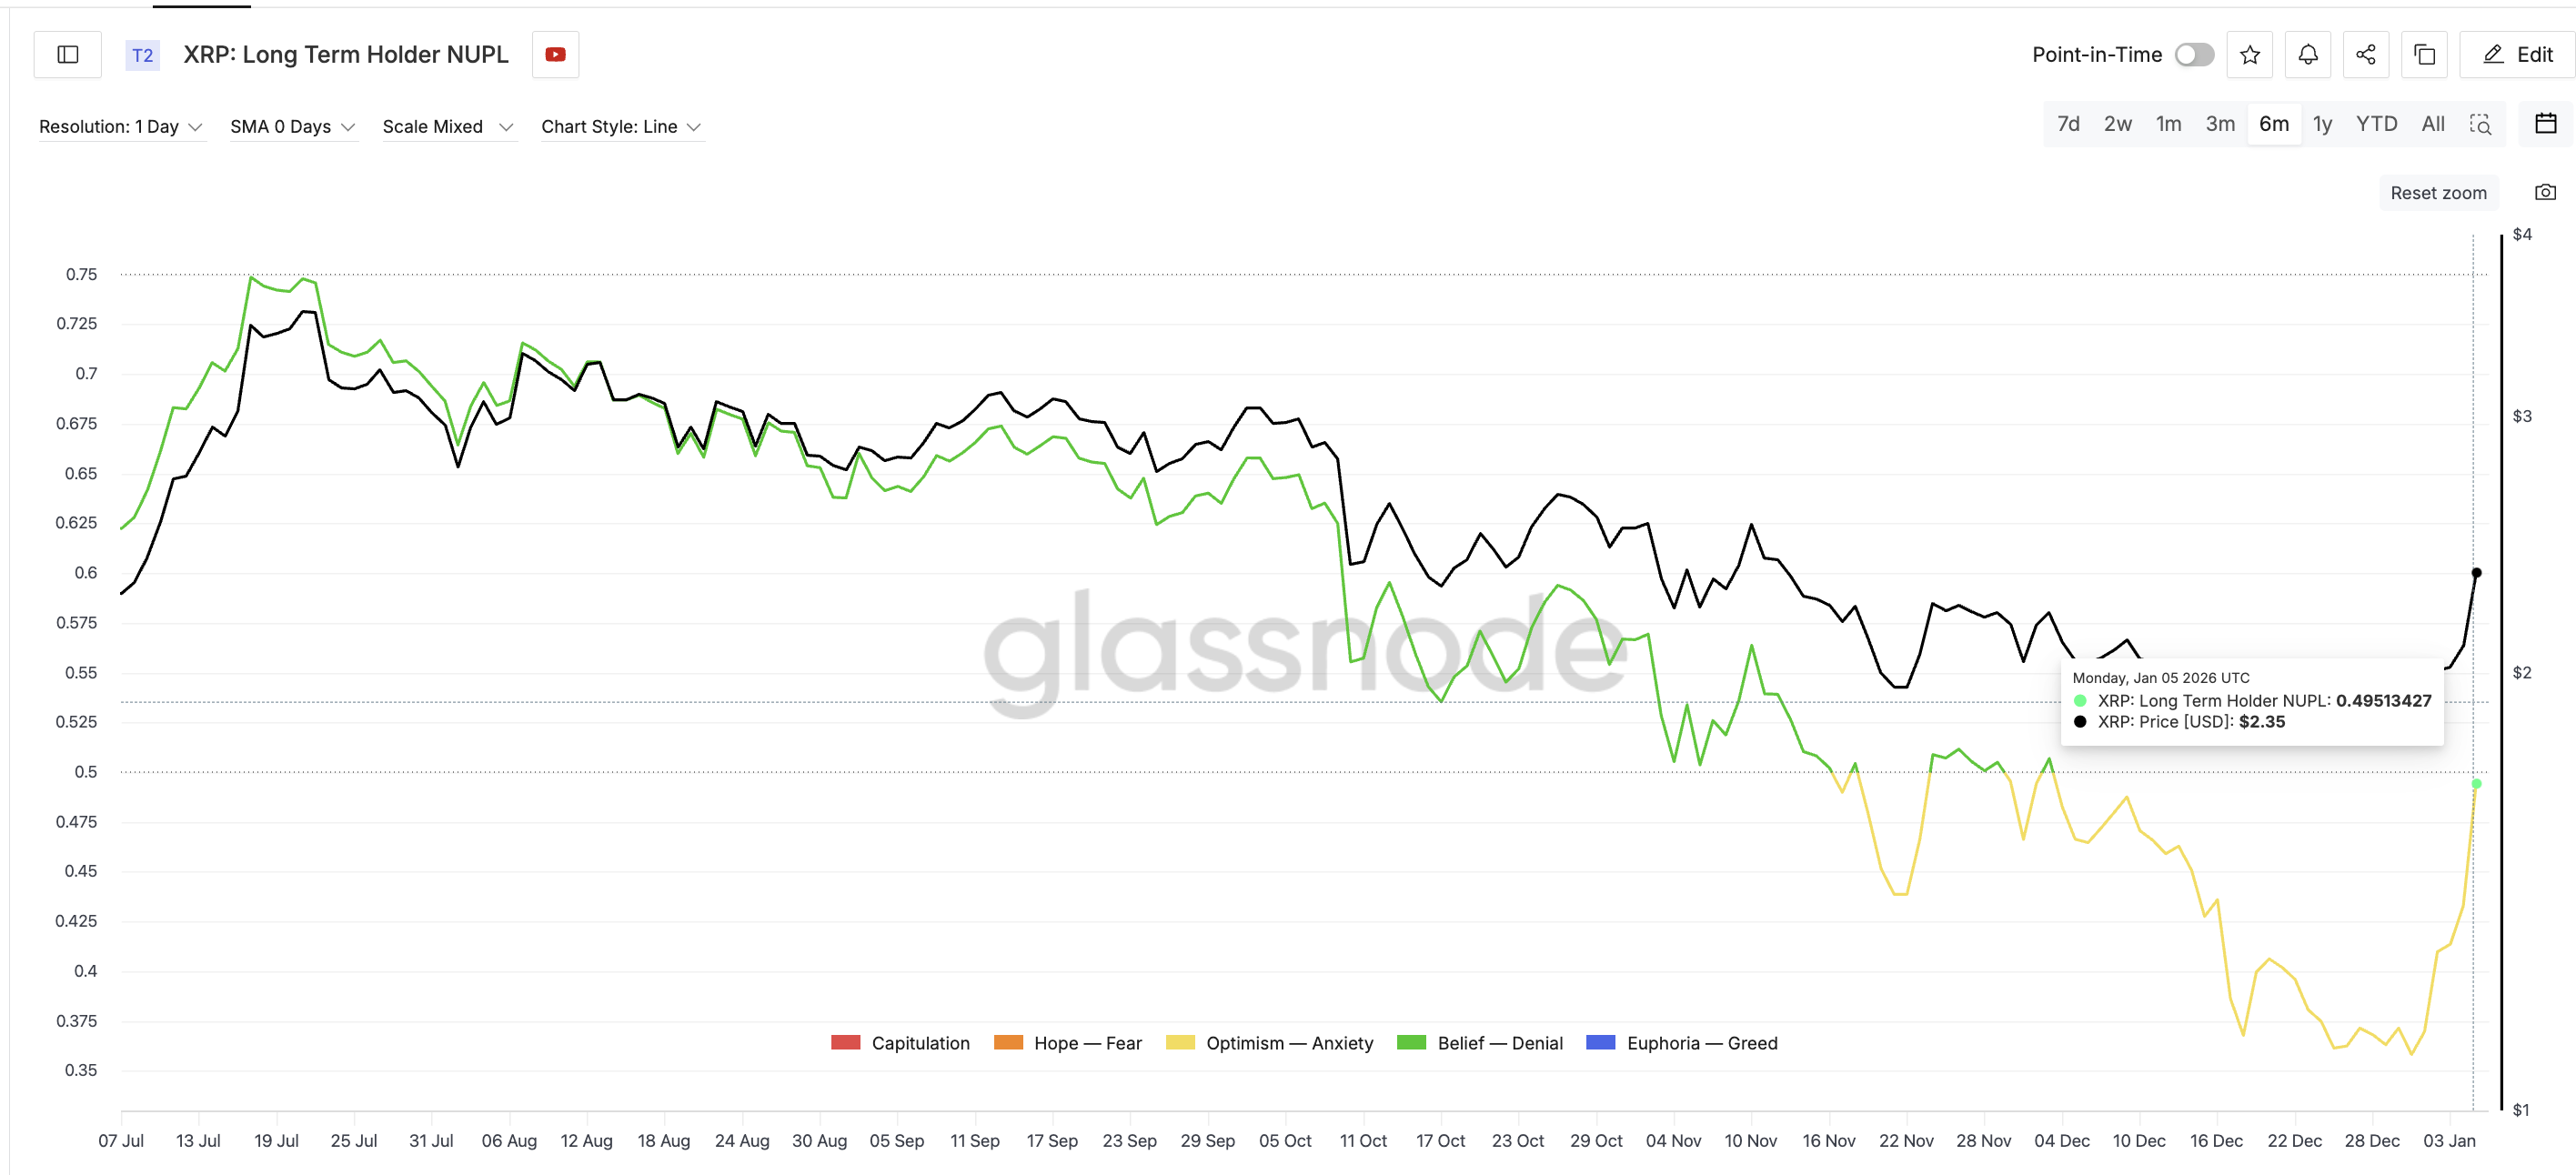
However, profit pressure is also rising. Long-term holder NUPL, which stands for net unrealized profit or loss, measures how much profit long-term holders are sitting on. NUPL has climbed back to levels last seen in early December.
At those levels around 0.48-0.49, $XRP corrected by roughly 14% over the following nine days. This does not guarantee a repeat, but it shows that the market is again entering a zone where profit-taking historically increased.
Importantly, hodler accumulation has slowed over the past two days, which is visible on revisiting the earlier metric. Long-term holders are still adding, but at a slower pace since January 4, suggesting that buyers are becoming more selective as prices and NUPL rise.
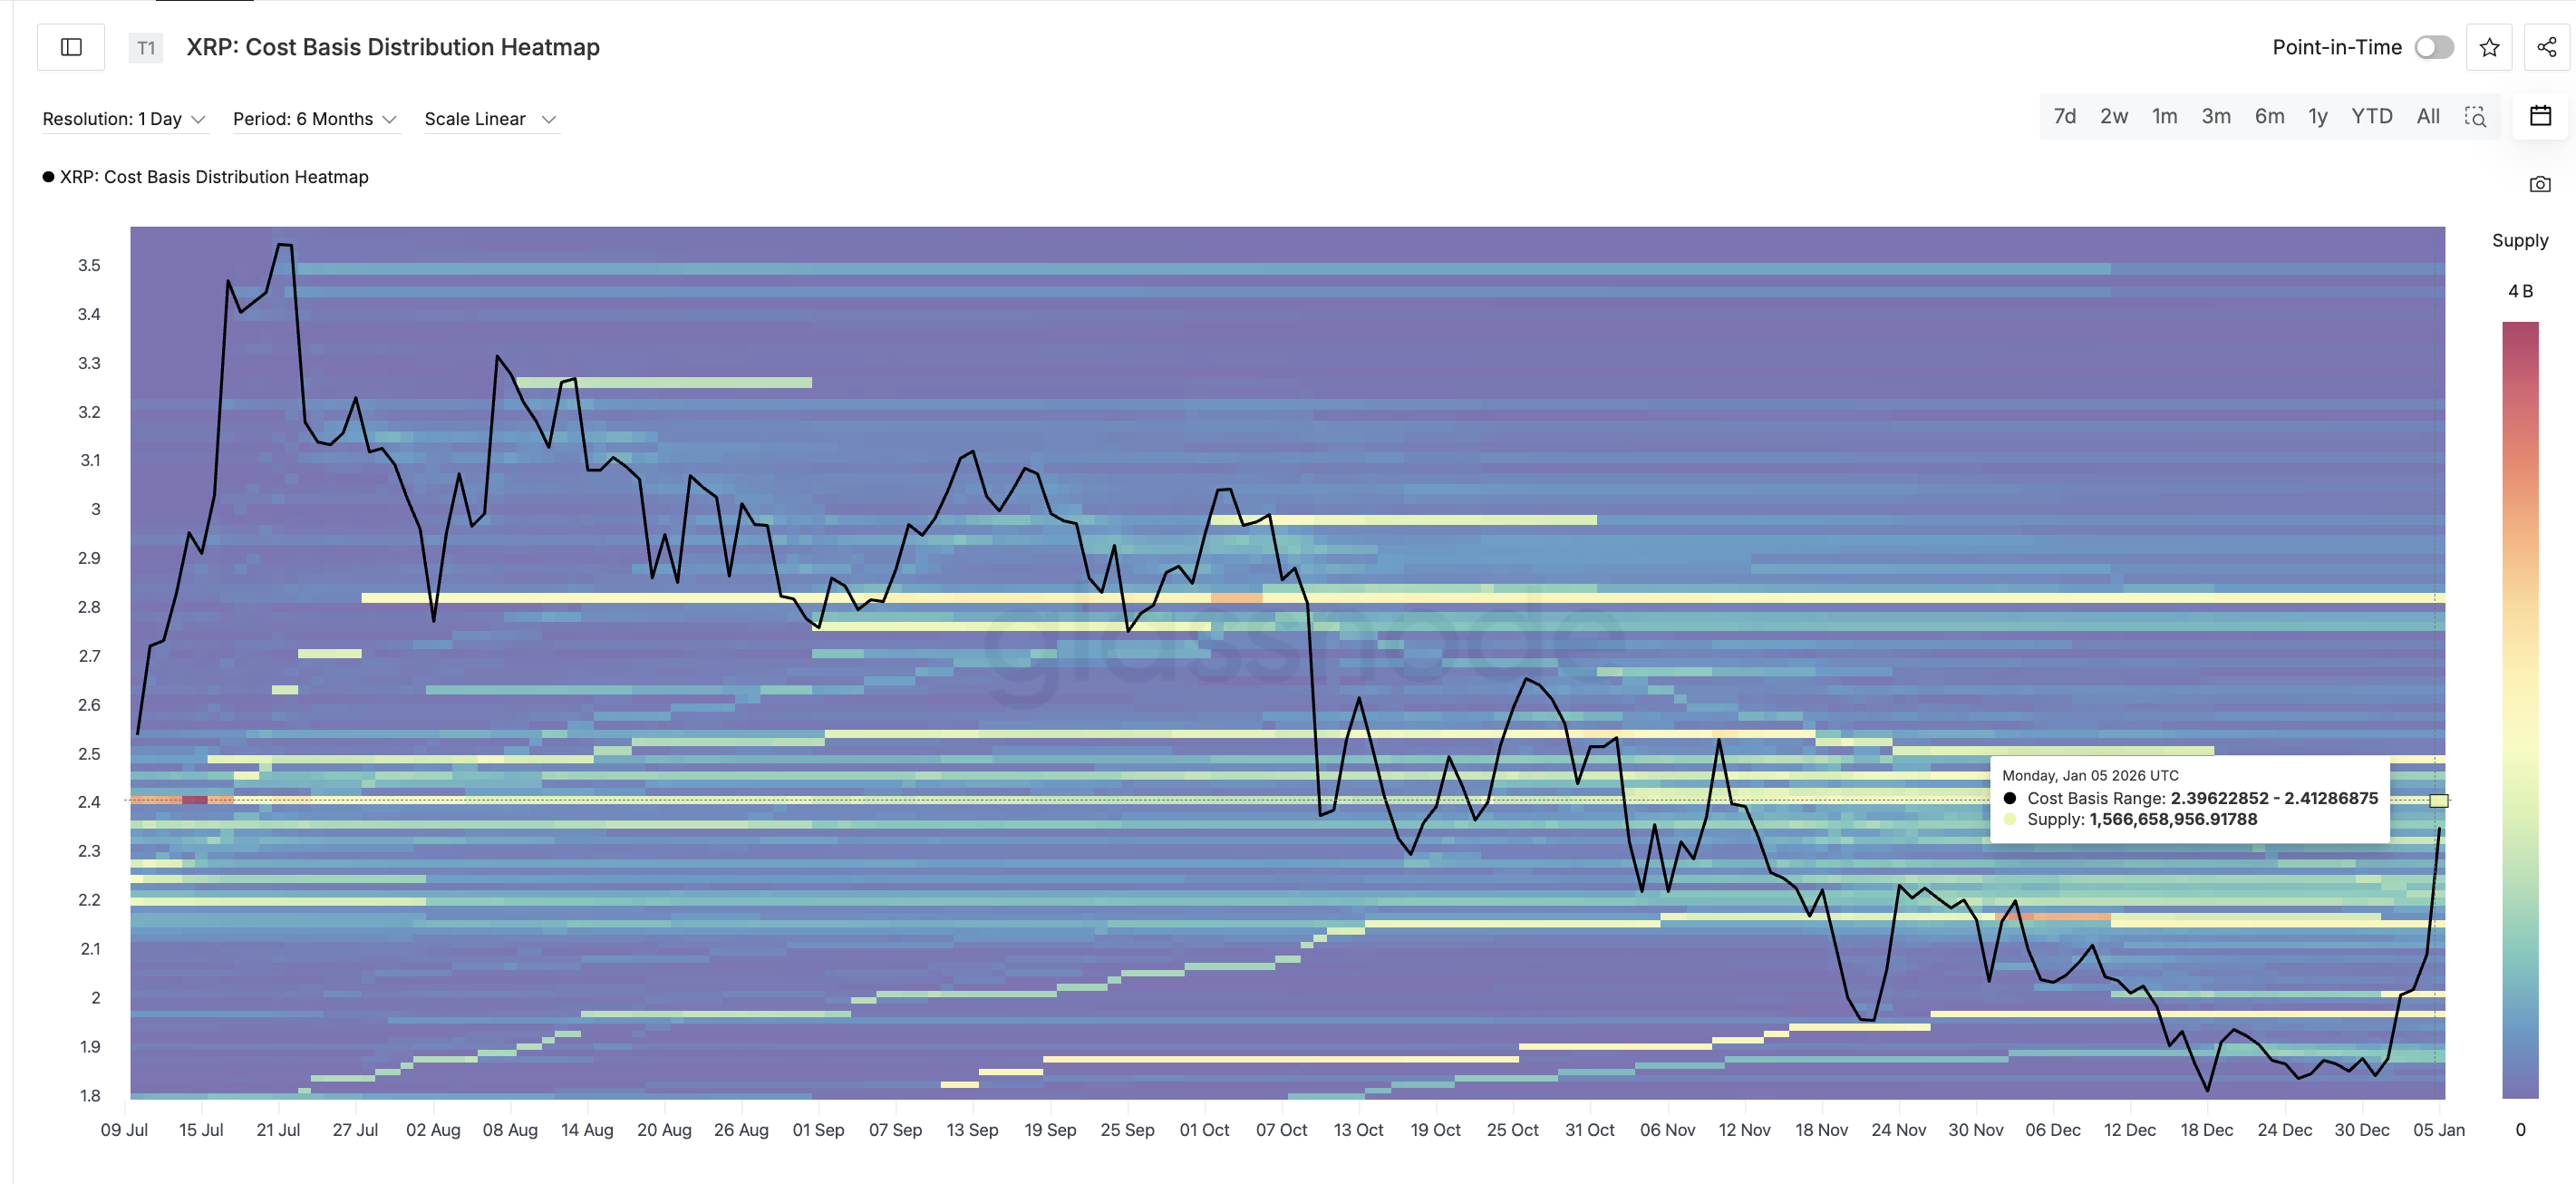
$XRP Price Prediction Now Hinges on the $2.41 Cost-Basis Wall
All technical and on-chain signals converge near the $2.41 zone.
The cost-basis distribution heatmap highlights this area as a major supply cluster. Cost basis shows where coins were previously bought. Between $2.39 and $2.41, roughly 1.56 billion $XRP were accumulated. When price revisits such zones, many holders sell to break even, creating resistance. The $XRP price chart from earlier also highlights that resistance zone.
 $XRP Heatmap">
This explains why $XRP has stalled near $2.41 and why OBV has flattened while NUPL continues rising.
For the bullish $XRP price prediction to remain valid, $XRP needs a clean daily close above $2.41. If that happens, overhead supply weakens, and the next upside target sits near $2.69. That would represent an additional upside of about 13% from current levels.
If $XRP fails to reclaim $2.41, downside risk increases. Initial support lies near $2.26, followed by a deeper support around $1.90. Even in a pullback scenario, the broader structure remains intact as long as the price holds above $1.77.
 $XRP Price Analysis">
$XRP’s rally has momentum, but it is now entering its most important test. The next phase of the $XRP price prediction depends not on indicators alone, but on whether buyers can decisively turn $2.41 from resistance into support.
The post $XRP Price Prediction Points to Another 13% Upside If Buyers Clear This One Level appeared first on BeInCrypto.