
The chart's structure makes it difficult to ignore the fact that Ethereum is about to enter a classic compression phase. An ascending trendline pushing from below, and a descending moving average pushing from above, are currently trapping the price. While there is no similar story for Bitcoin and XRP, both assets are aiming higher for now.
Ethereum getting squeezed
Ethereum keeps printing higher lows as it declines. Every pullback is shallower than the one before it, indicating that sellers are no longer able to significantly reduce prices. This rising trendline indicates consistent defense rather than aggressive buying. Every time, buyers are entering the market earlier, which reduces the range and raises pressure.
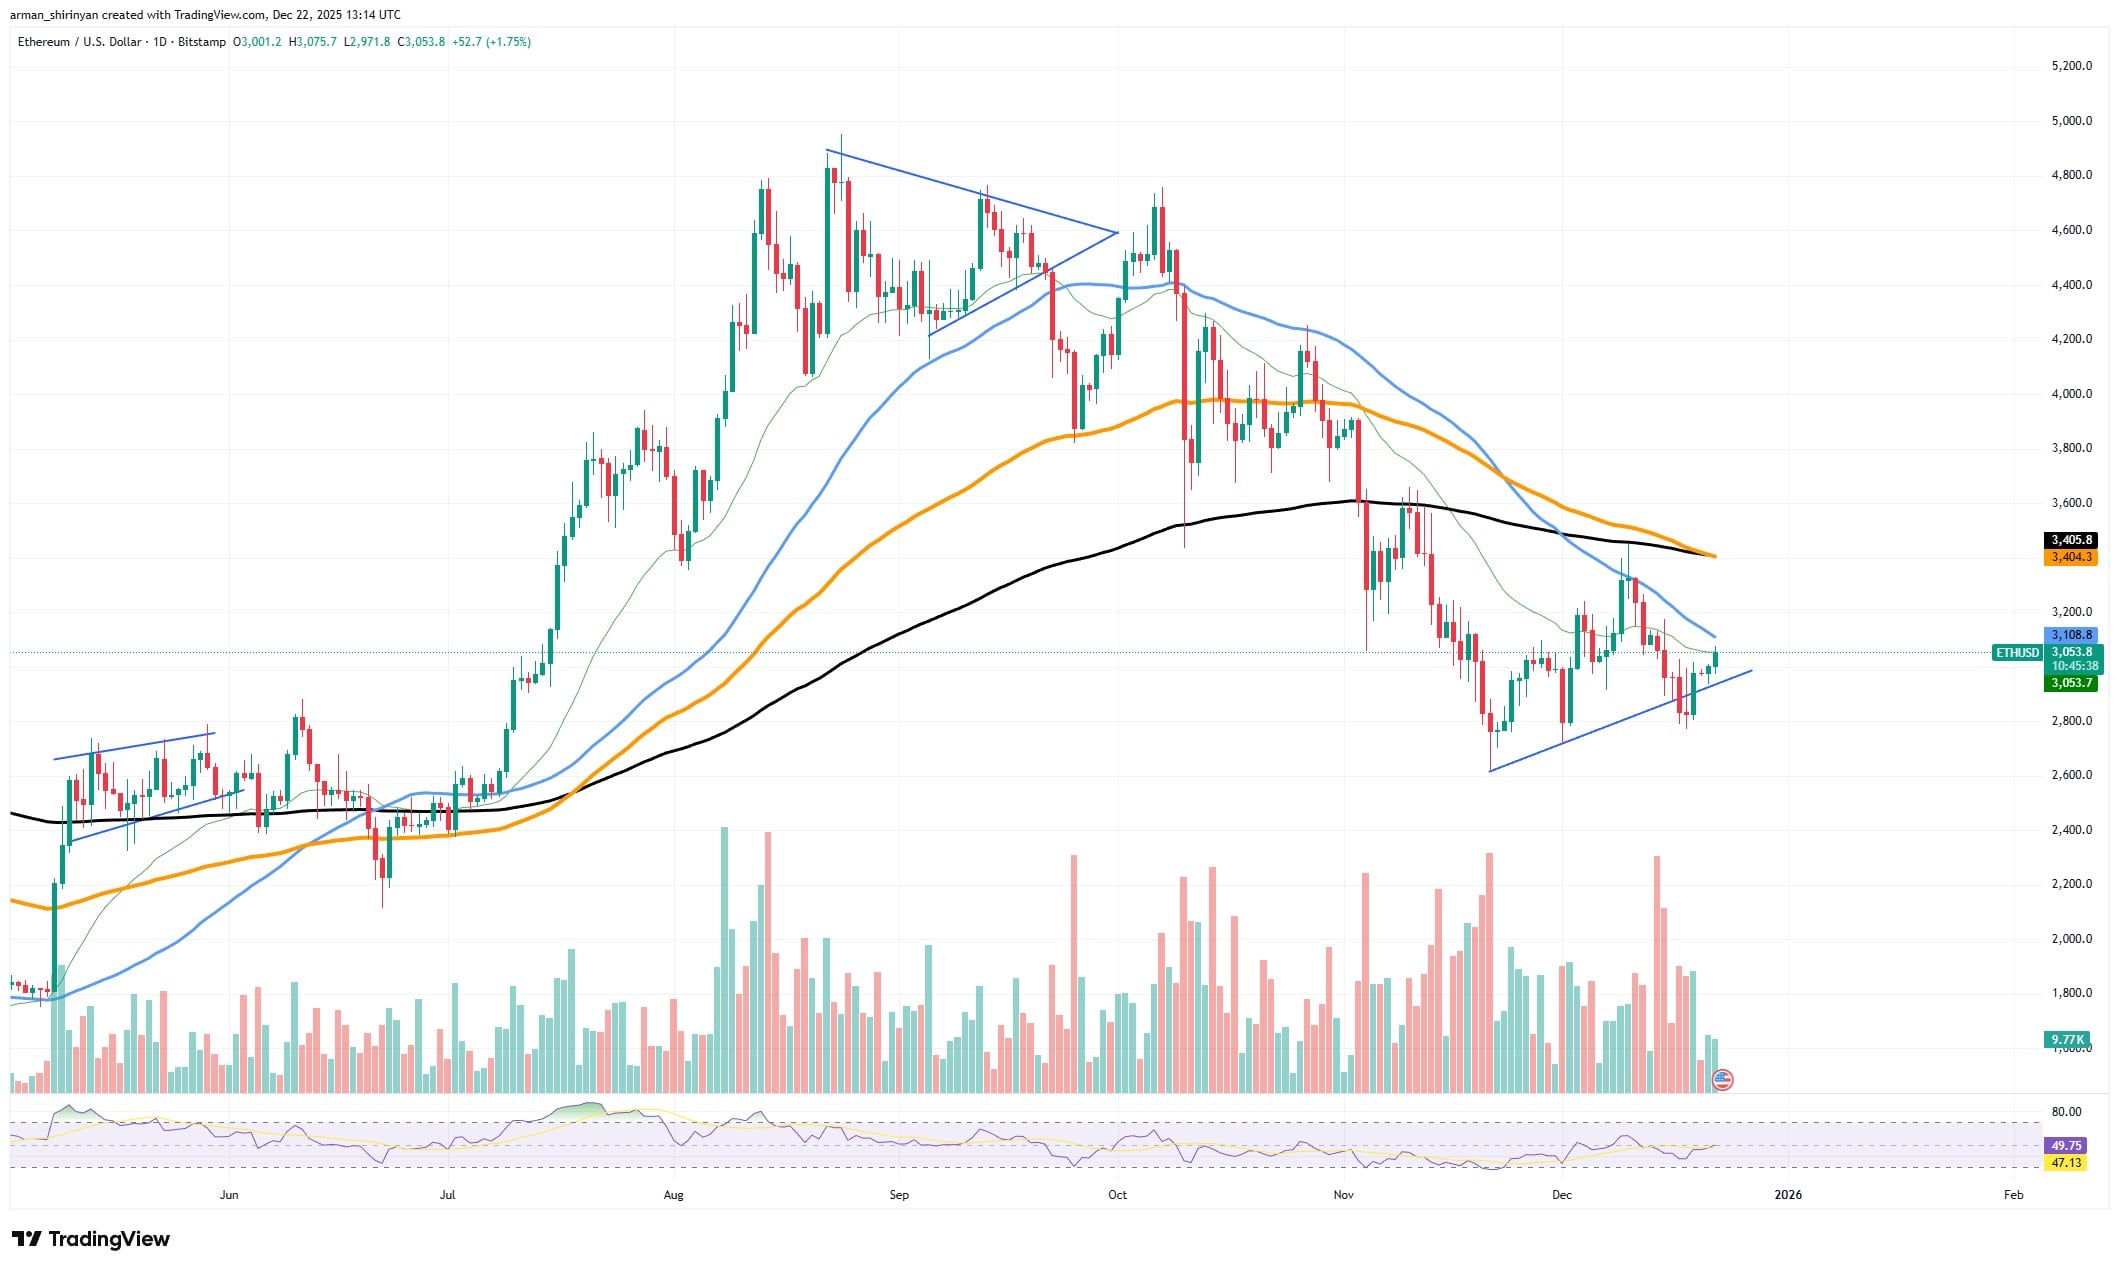
However, declining moving averages continue to limit Ethereum's potential. These averages serve as dynamic resistance and indicate that the overall trend is still corrective, as opposed to impulsively optimistic. ETH has not been able to regain clear bullish territory because every attempt to move higher has been met with supply from traders leaving rallies. For this reason, rather than growing, recent rebounds have rapidly stagnated.
Because of the compression of volatility, this squeeze is significant. Following previous spikes, volume has returned to normal and price action has become more controlled and deliberate. That typically occurs prior to expansion rather than the continuation of the grind. The market is awaiting a catalyst, which could be an external trigger or a technical break.
The squeeze resolves to the upside if Ethereum breaks and holds above the declining moving average. As short positions are put under pressure and sidelined capital is compelled to return, that would indicate a change in market control and pave the way for a more extensive recovery. A breakdown below the rising trendline would render the higher-low structure invalid and probably result in another leg downward toward earlier support zones.
XRP needs more footing
XRP is currently in an uncomfortable but critical area, where it will soon be clear whether this is a real reversal or just a dead-cat bounce. Price action at the moment points to hesitancy rather than strength. In addition to not selling aggressively, the market is not drawing in significant buyers.
XRP is still stuck below all of the major moving averages, from a structural perspective. The 50-day, 100-day and 200-day lines all form a layered resistance zone above price as they slope downward. This indicates that there is still a corrective trend in general. Unless XRP is able to recover and maintain at least the mid-range moving averages, any bounce that takes place here would be, by definition, a countertrend.
Compression within a descending channel is evident in the recent price behavior. Rebounds are feeble and fleeting, but lows are only slightly defended. This suggests that while sellers are no longer in a panic, buyers lack the confidence to intervene with size.
The view is supported by volume. Green candles are not expanding, indicating that upward trends are primarily caused by a lack of sales rather than real demand. This is the narrow window of opportunity for XRP.
A relief rally toward the $2.10-$2.30 region becomes feasible if the price can hold above the present support band and break out of the declining channel with volume. That area coincides with multiple moving averages and earlier support that turned into resistance. But such a move would probably fade in the absence of strong follow-through.
It would be more harmful if current levels were not maintained. A breakdown would pave the way for another leg down toward deeper historical support and strengthen the pattern of lower highs and lower lows. At that point, the market would have to reevaluate XRP as an asset that is still looking for a bottom rather than as a coiled asset.
Bitcoin can feel $90,000
Once again, Bitcoin is fighting for the $90,000 mark, and this third attempt is more significant than the first two. Repeated assessments of a significant psychological level typically show intent rather than weakening it by default. As of right now, the answer is conditional rather than absolute due to the mixed intent.
Technically speaking, Bitcoin has recovered the $88,000-$89,000 range and is currently trading just above $90,000. It is not insignificant. The most recent recovery followed a steep sell-off driven by liquidation, which was followed by consolidation rather than panic. Volume increased during the recovery leg before cooling off, indicating that most forced sellers have left but that aggressive buyers have not yet taken over.
Overhead structure is the issue. The 200-day moving average looms higher as a macro filter, while the 50-day and 100-day moving averages continue to slope downward and remain above the price. As a result, there is a compression zone where upward progress is feasible but limited. Bitcoin requires a clear daily close with follow-through volume in order to break and hold above $90,000. In the absence of that, the price runs the risk of falling back into range and making this level another unsuccessful breakout.
That tension is reflected in momentum indicators. RSI is not yet in bullish expansion mode, but it is rebounding from oversold territory. This is consistent with the chart's depiction of stabilization rather than acceleration. Put another way, Bitcoin is neither weak nor convincingly strong.
What comes next, $50,000 or $100,000? $50,000 is not the market's base case in the near future. Well above that point, structural support is still present. However, unless Bitcoin firmly moves $90,000 into support, $100,000 also appears premature. This skepticism is evident on prediction markets such as Kalshi, where traders are largely discounting a near-term six-figure breakout.