$XRP price remained in a tight range today, Dec. 10, as some of the Ripple USD metrics continued to deteriorate.
- $XRP price remained in a tight range this week, even as Bitcoin and other altcoins rallied.
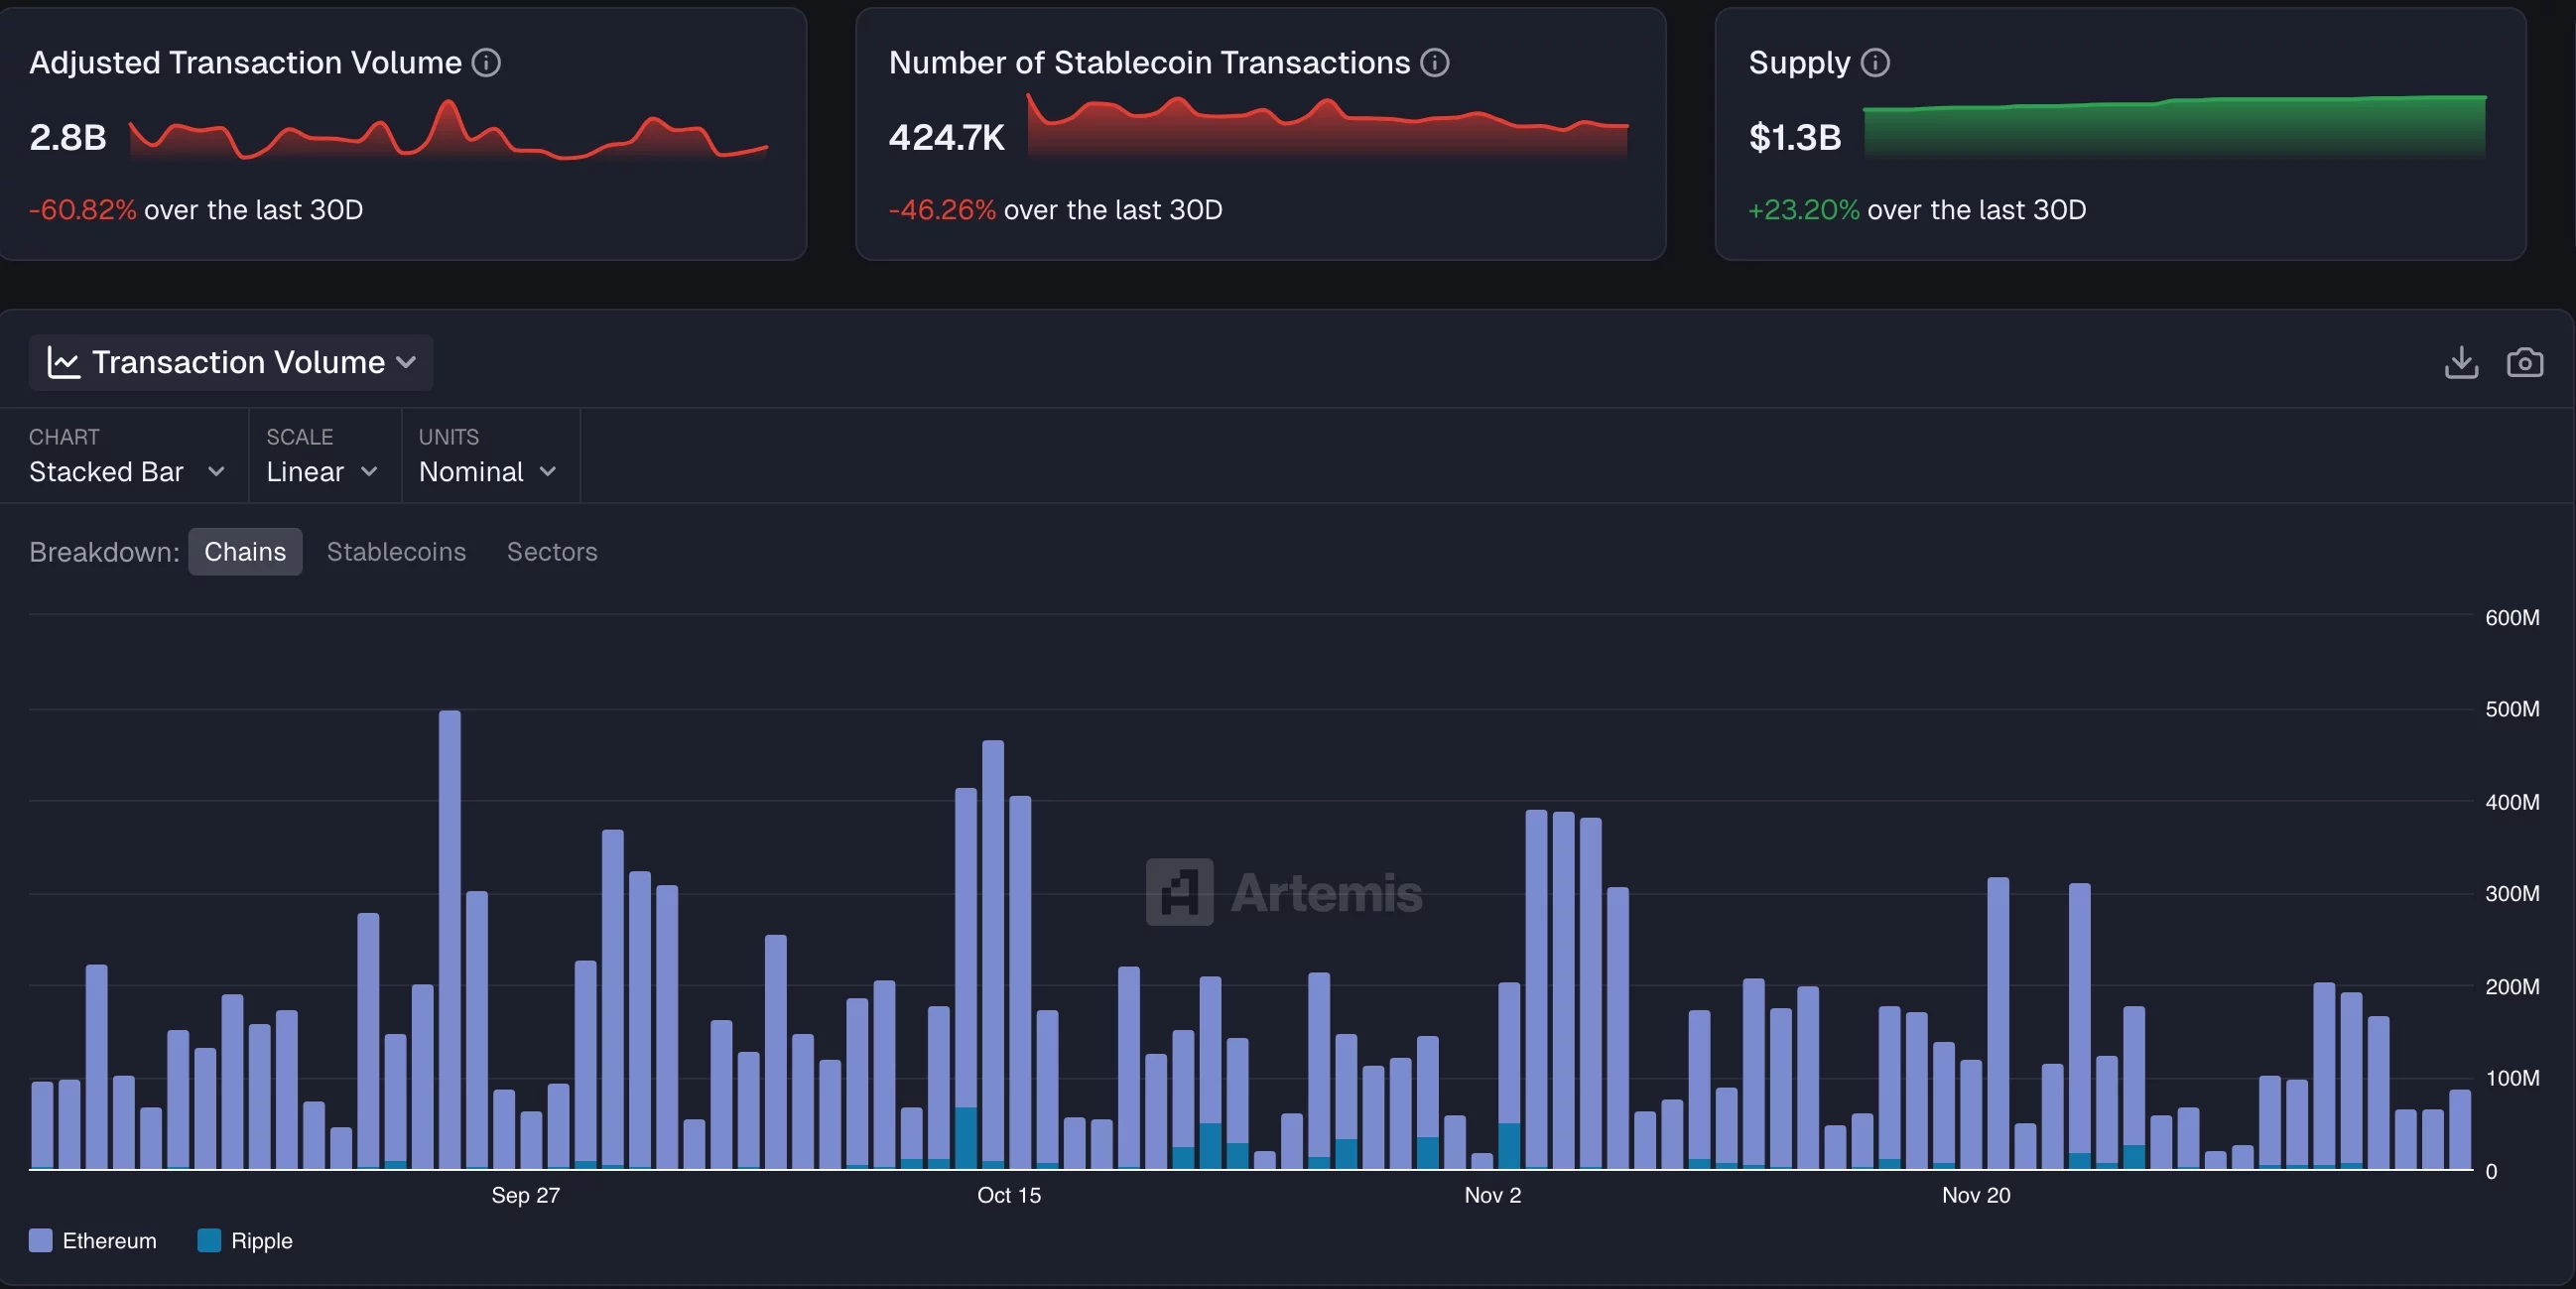
- The adjusted transaction volume of $RLUSD stablecoin has dropped by 60% in the last 30 days.
- Similarly, the number of stablecoin transactions dropped by 46% to 424k.
Ripple ($XRP) token dropped to a low of $2.0640, down from this week’s high of $2.1780. This decline happened even as Bitcoin ($BTC) and other altcoins held steady ahead of the Federal Reserve’s interest rate decision.
Ripple USD metrics are deteriorating
Data compiled by Artemis shows that the important Ripple USD ($RLUSD) metrics have deteriorated in the past 30 days.
On the positive side, the supply of $RLUSD tokens in circulation has jumped by 23.20% in the past 30 days to over $1.3 billion.
However, there are signs that token usage has waned during this period. The number of active addresses has decreased by 28%.
At the same time, the number of stablecoin transactions dropped by 46% in this period to 424k, while the adjusted transaction volume declined by a whopping 60% to $2.8 billion.
Additionally, most $RLUSD transactions occur on the Ethereum (ETH) network, with only a small share on the $XRP Ledger network. Its Ethereum transactions on Monday totaled $84 million, compared with $XRP Ledger’s $2.7 million.
Meanwhile, demand for the recently launched $XRP ETFs fell on Tuesday, even as Bitcoin ($BTC) and most altcoins rebounded. Total inflows fell to $8.73 million from $38 million the previous day. It was the second-worst day in terms of inflows since the SEC approved Canary’s XRPC ETF.
On the bright side, these ETFs have never experienced outflows, and their cumulative inflows are nearing $1 billion.
$XRP price technical analysis
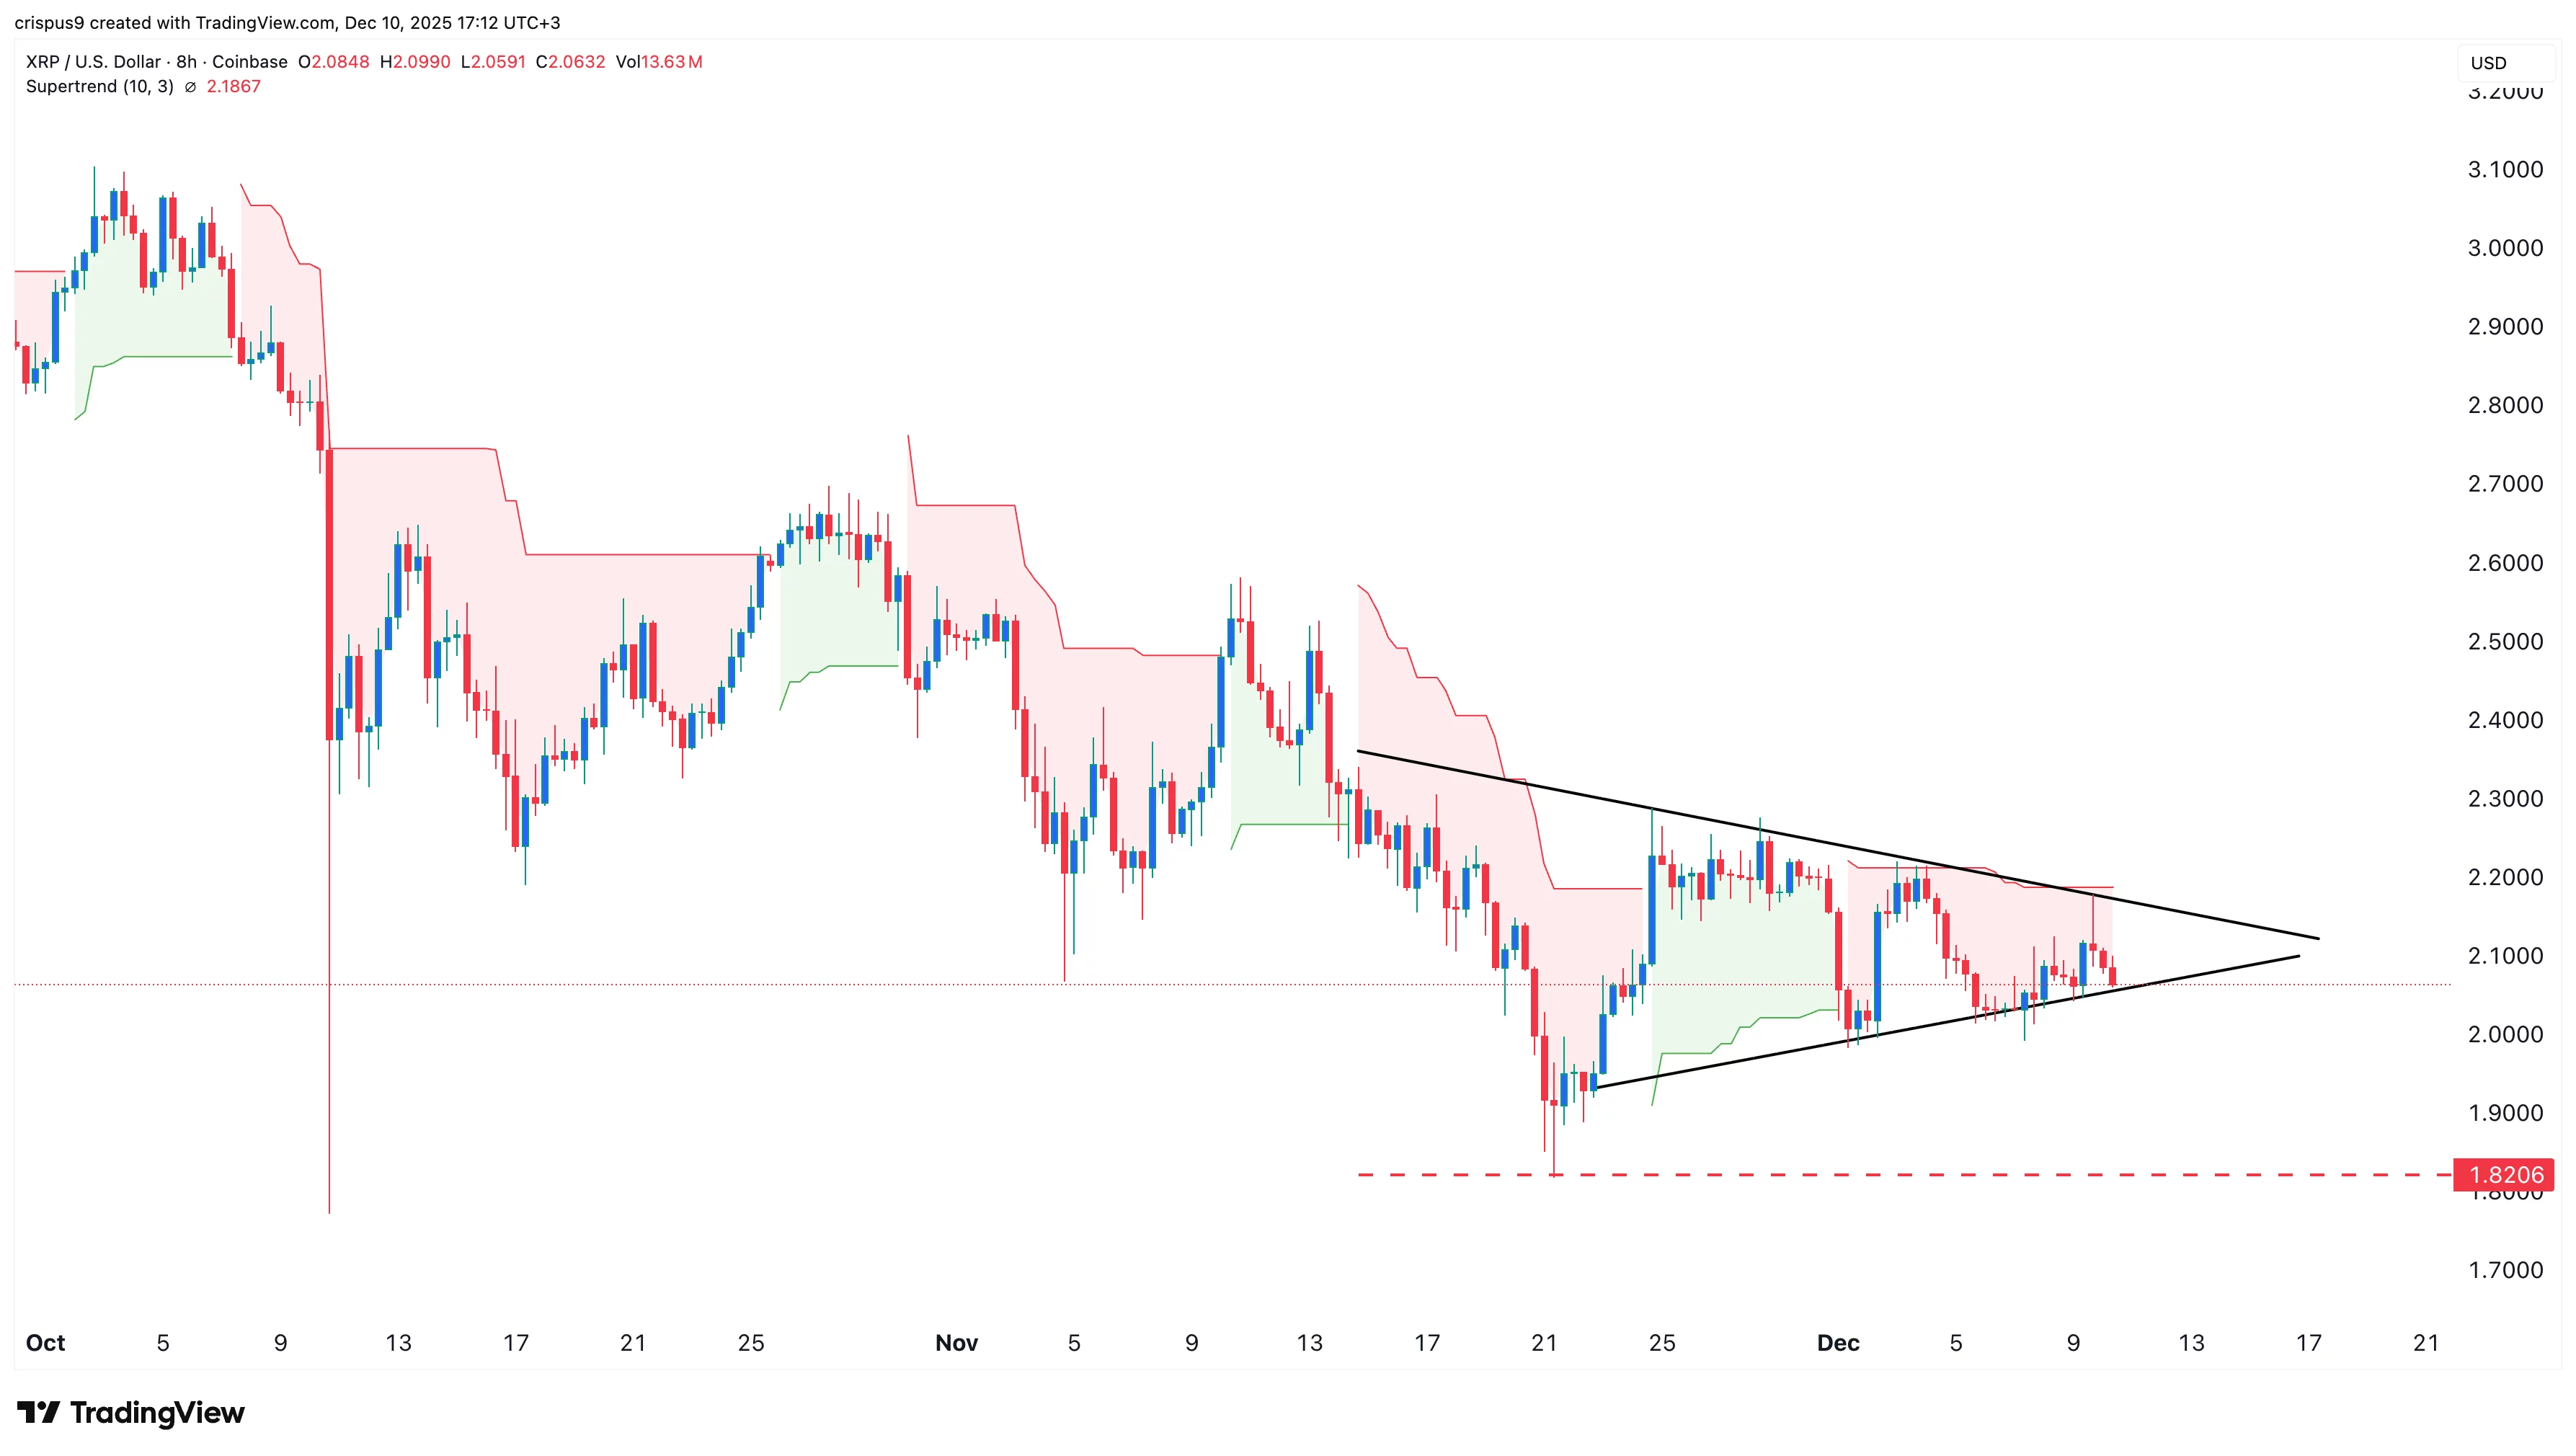
The eight-hour chart shows that the $XRP price has remained in a tight range in the past few days. It has formed a symmetrical triangle pattern, with its two lines about to converge.
The token dipped slightly below the Ichimoku cloud, while the Supertrend has remained red throughout the month.
Therefore, there is a risk of a strong bearish breakout to the key support level at $1.8200, its lowest level on Nov. 21. On the other hand, a move above the upper side of the symmetrical triangle will signal further gains.