
Table of Contents
The broader crypto market has spent much of the past month struggling to regain momentum, with many assets still trading below key psychological levels. Yet Telcoin (TEL) has stood out with a surprisingly resilient performance. Following a sharp reversal in early November, the token has continued to print constructive price action on the daily timeframe—suggesting that buyers may be regaining control after months of sustained decline.
TEL’s recovery began with a clean breakout from a long-running descending channel that had capped the price for most of Q3 and early Q4. That move, a decisive surge from the $0.0030 region, marked TEL’s strongest upside expansion in months and set the tone for a broader bullish shift. Since then, the price has pulled back modestly but remained firmly above key moving averages, an encouraging sign given the market environment.
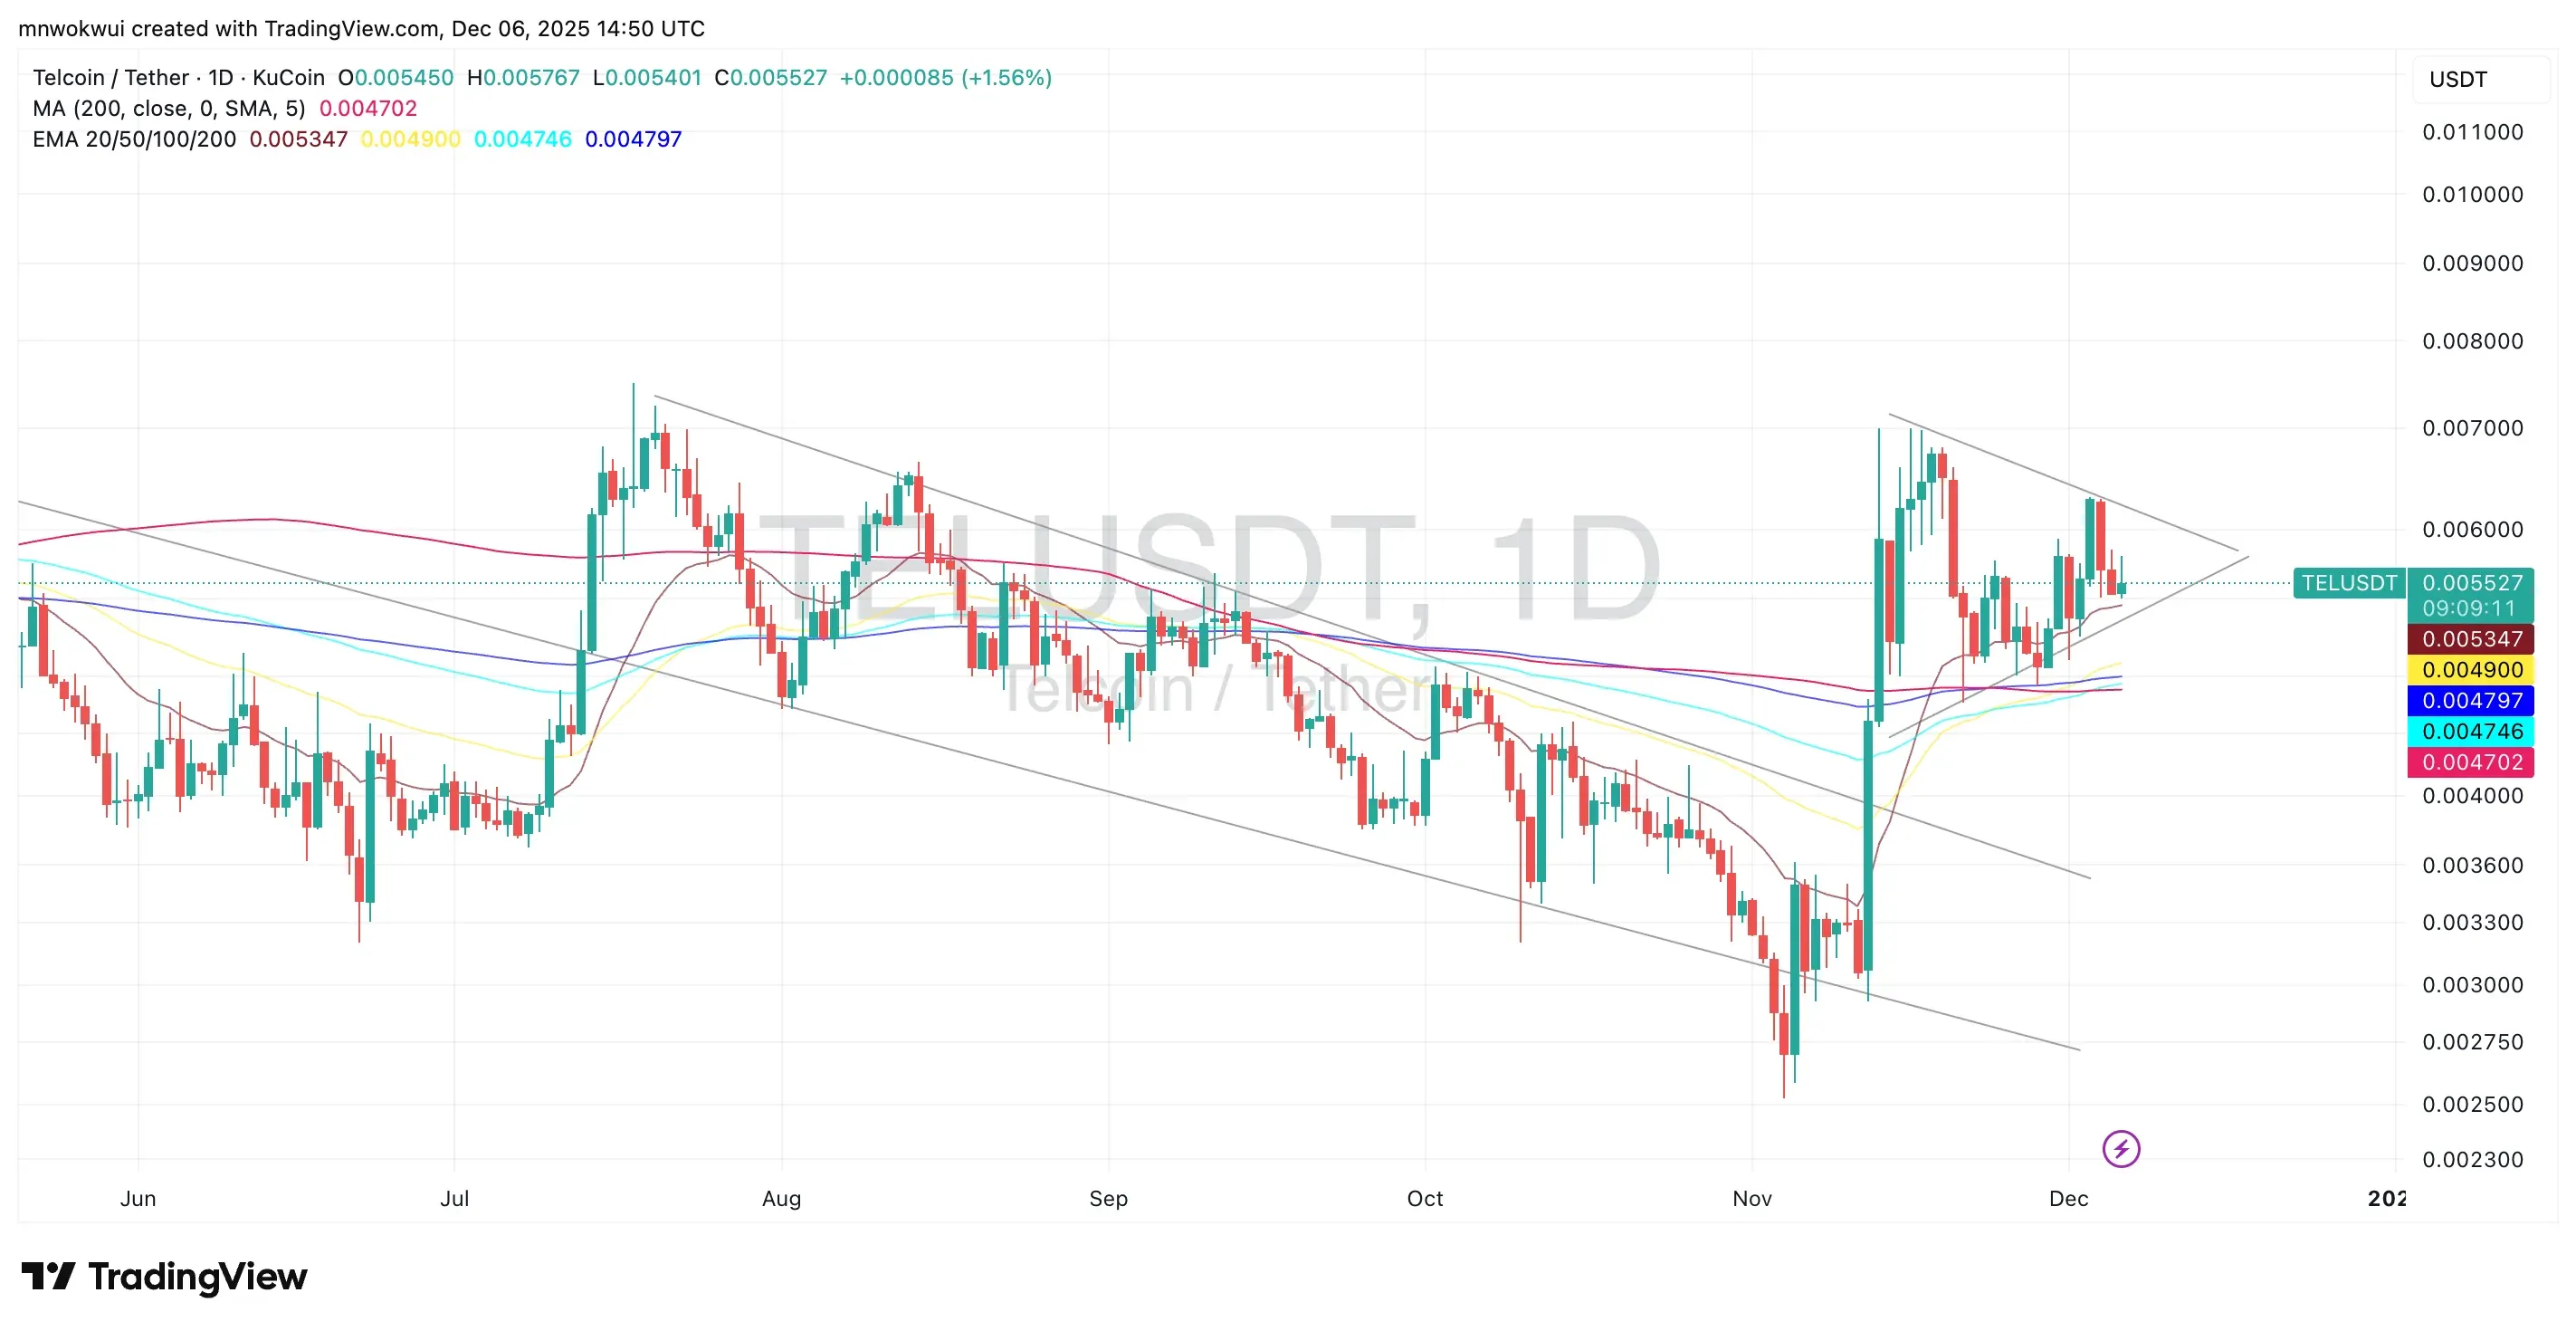
Attention now turns to the symmetrical triangle pattern forming from mid-November to early December. This structure—which typically indicates a period of consolidation before a larger directional move—has compressed TEL into a tight apex around the $0.0053–$0.0056 zone. With volatility narrowing, traders are watching closely for a decisive breakout.
Bullish Scenario: Continuation of November’s Breakout Momentum
From a technical standpoint, the bulls still retain a meaningful edge. TEL continues to trade above its 20, 50, 100, and 200-day EMAs, with the moving averages beginning to stack in a more constructive order. This is often an early signal of a trend reversal.
A breakout above the triangle’s upper boundary near $0.0058–$0.0060 would confirm renewed upward momentum. Such a move could open the door to a retest of November’s local high around $0.0070, followed by an extension toward $0.0078–$0.0082, an area of historical supply. A broader market recovery would strengthen this case.
Importantly, the volume on the November rally was significantly higher than the current consolidation phase—another classic sign of healthy bullish continuation. If buyers return with conviction, TEL may build on its early-November breakout and transition into a mid-term uptrend.
Bearish Scenario: Breakdown From the Triangle and Return to Support
Although the bias leans bullish, the bears are not without opportunities. A failure to hold the triangle’s lower trendline—currently positioned around $0.0052—could expose TEL to a deeper pullback. The first meaningful support sits at the cluster of EMAs around $0.0047–$0.0049. Losing that area would weaken the bullish structure and may trigger a retest of $0.0042, a support level established during the November surge.
A breakdown accompanied by rising volume would indicate that sellers are attempting to reclaim control. In this case, the recovery from early November could be viewed as a temporary relief rally rather than the beginning of a sustained trend reversal.
Outlook
TEL’s chart paints a more optimistic picture than many assets in the current market. The breakout from the multi-month descending channel in early November remains a significant structural shift, and the ongoing consolidation through a symmetrical triangle suggests that the market is preparing for its next decisive move.
Whether that move continues the November momentum or reverts lower will depend largely on how price behaves at the apex of the triangle. For now, TEL remains one of the more technically constructive mid-caps heading into December, with traders watching closely for confirmation in either direction.