
Dogecoin faces rejection at the middle Bollinger Band, but the meme coin’s TD Sequential signals a potential buying opportunity.
Dogecoin (DOGE) has dropped by 0.6% in the past 24 hours, currently priced at $0.1496. Notably, its daily trading range falls between $0.1478 and $0.1529. Despite this lack of movement in the short term, its 24-hour trading volume stands at $1.31 billion. This indicates sustained interest in the asset.
Looking at its performance over the past week, Dogecoin has seen a decline of 2.3%, reflecting the broader market trend. Over the past two weeks, the coin’s performance has been similarly underwhelming, with a 4.6% decrease. This performance, happening at a time when the broader market is attempting a recovery, leaves traders with mixed sentiments. Will Dogecoin recover and target higher?
Dogecoin Price Analysis
Notably, the Dogecoin chart from TradingView presents several key technical indicators that suggest the current market sentiment is indecisive. The chart includes Bollinger Bands, which indicate relatively low volatility, as the bands have contracted. This narrowing suggests that Dogecoin may break out or continue consolidating.
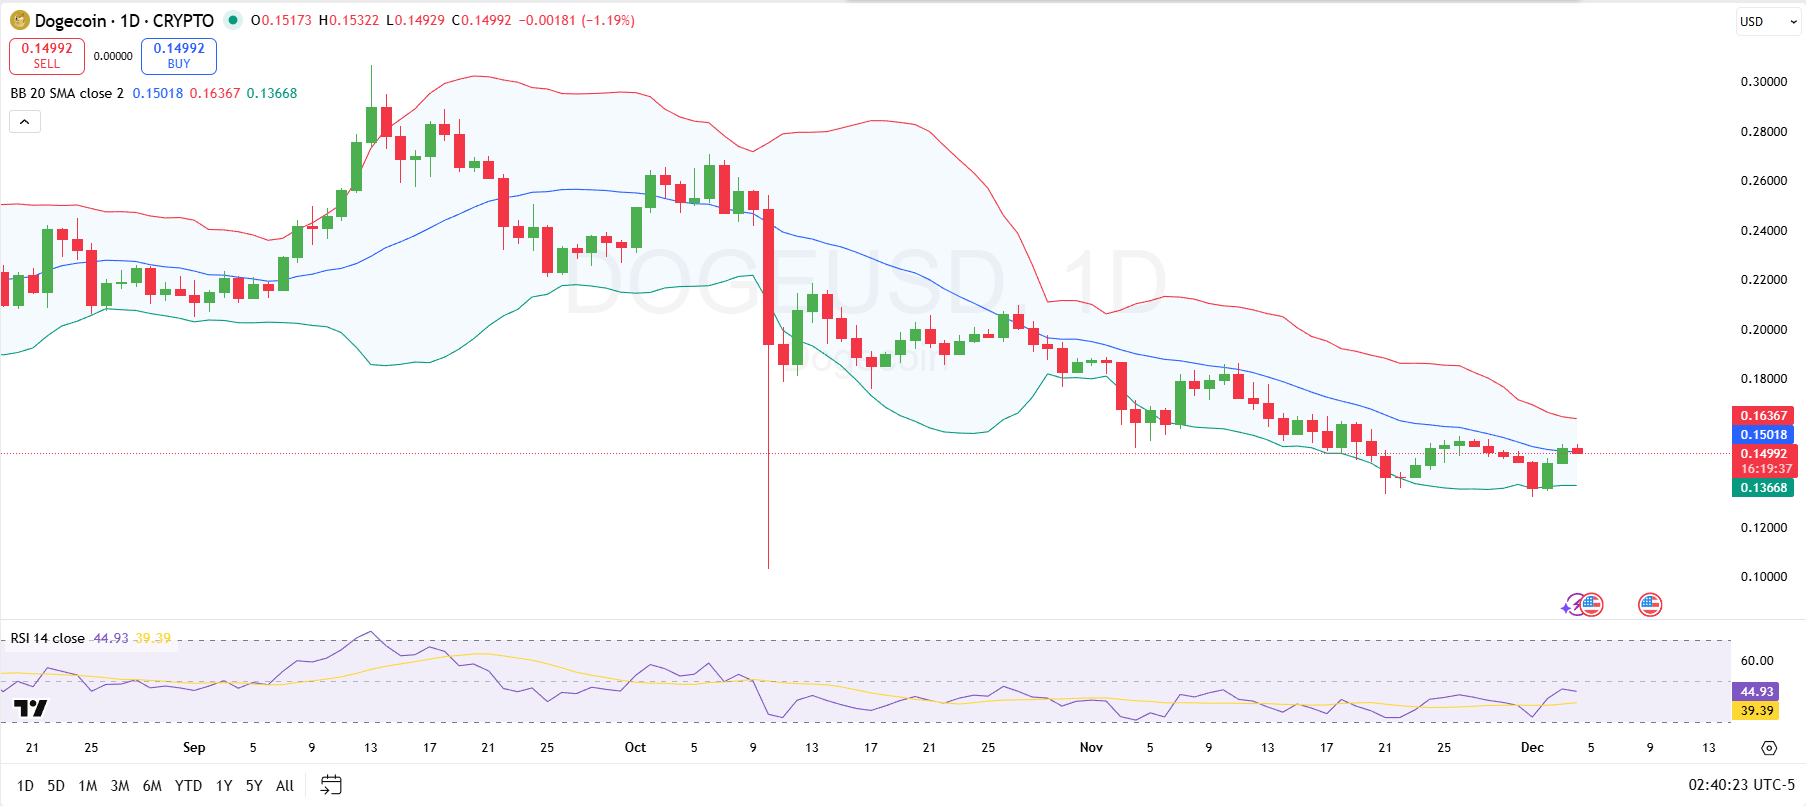
The price is currently heading toward the lower Bollinger Band ($0.13668), which acts as a support level, while the upper Bollinger Band ($0.16367) serves as the immediate resistance. If Dogecoin fails to hold at the current support level, the next area to watch would be around $0.13, where previous price action indicates a potential bounce.
In addition to the Bollinger Bands, the RSI (Relative Strength Index) sits at 44.93, just below the neutral 50 level. This suggests that neither buyers nor sellers have pushed the market into an overbought or oversold condition, typically signaling indecision.
Investors should watch the RSI’s movement closely, as a drop below 30 could indicate oversold conditions and a potential reversal to the upside, while a rise above 50 would indicate increasing bullish momentum.
TD Sequential Says Buy
Meanwhile, in a weekly chart shared on X, veteran analyst Ali Martinez called attention to the TD Sequential indicator, used to predict potential price exhaustion points and reversals.

The key signal here is the “S13” label, which indicates a Sequential Setup 13, signaling a possible buying opportunity based on the TD Sequential method. The 9 label further reinforces this buy signal.
Also, Trader Tardigrade’s chart on Dogecoin highlights a key technical pattern that could signal a significant reversal in price.
Specifically, the analyst points out the formation of a Dragonfly Doji, a bullish reversal candlestick pattern that forms after a downtrend. This shows buyers stepping in at lower levels and driving the price back toward the candle’s upper range, hinting at growing bullish momentum.
This pattern has appeared at a crucial support at $0.15 level that aligns with a long-term uptrend trendline. Looking ahead, Trader Tardigrade forecasts a potential run-up to $1, marking a 611.80% gain from that support.