Solana stalls at key resistance as technical signals and views from market analysts suggest this could be a fragile rebound that may face pullback.
Solana ($SOL) is ending the week on relatively firm footing, although momentum has shifted more bearish. $SOL is hovering around $139.58 on CoinGecko, down 2.9% in the past day and roughly 6.5% higher over the last week.
Price action shows the asset recovering from the $121 area, forming a sequence of green candles before a sharp late-week move that briefly pushed the market above $144. Even after a modest pullback, Solana still sits in the upper half of its recent range, but has failed to surpass a key resistance level.
The weekly pattern suggests steady demand, as buyers repeatedly stepped in on dips and drove the price to successive higher peaks. At the same time, the reaction near the $144 region has created a short-term ceiling, setting the stage for a deeper look at whether $SOL can build a sustained push above this zone or face a leg down.
Solana Price Analysis
From a technical perspective, Solana is still working through a corrective phase after dropping from the late-October swing high above $205 to the mid-November low around $121. The Fibonacci retracement drawn over this swing shows that the current rebound has so far struggled to clear the 23.6% level around $141, with price now hovering below that area.

Above, the next resistance clusters sit near the 38.2% retracement around $154, the 50% level near $163, and the 61.8% level around $173.
Unless bulls can reclaim at least the 23.6%–38.2% band with conviction, the bounce still looks more like a relief rally inside a broader downtrend than a confirmed trend reversal. If the price faces further resistance at 23.6%, Solana could plunge further to test the liquidity at $121.65.
Meanwhile, momentum indicators back up this cautious view. Specifically, the daily RSI has recovered from near-oversold readings around 30 to roughly 42, signaling that the intense selling pressure has cooled but that buyers do not yet have clear control.
The oscillator remains below the neutral 50 line, keeping the bias slightly bearish. A sustained move in RSI above 50–60, coupled with a break of the $153–$163 Fibonacci zone, would strengthen the case that November’s low marked a medium-term bottom.
Solana Has Bottomed for a While?
Elsewhere, a post by analyst Ted on X suggests that Solana might have reached a short-term bottom, pointing to the rebound in Solana-treasury stocks. His post highlights $527.9 million in inflows to the Bitwise Solana ETF since November 10.
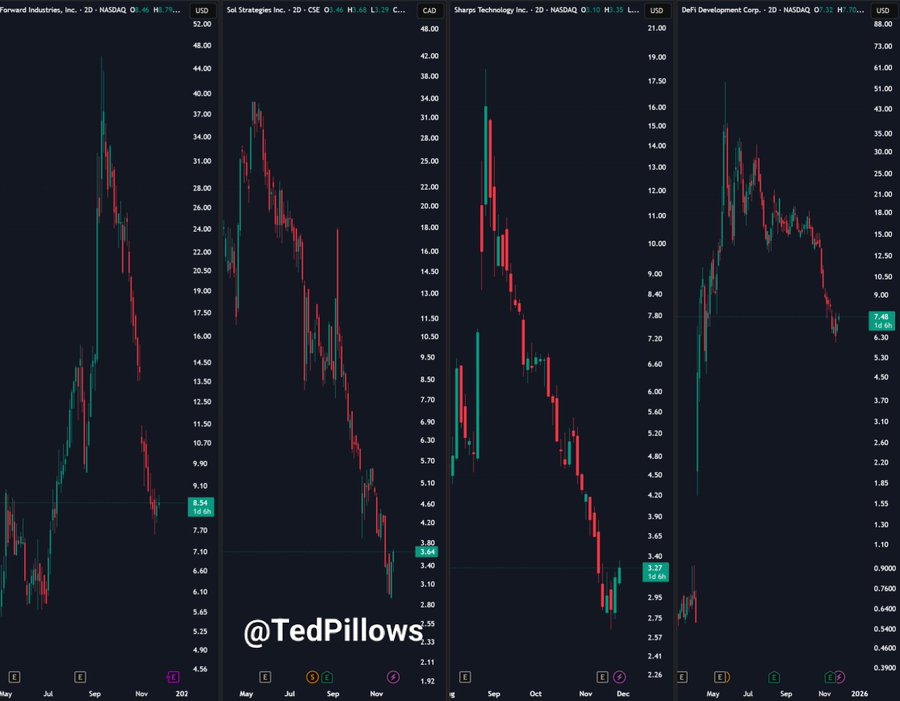
Accompanying charts depict recent upticks in stocks of Solana-linked treasury firms like Sol Strategies Inc. and SharpLink Technology, indicating correlated recovery in traditional finance exposure to the ecosystem.
According to the analyst, it seems Solana has bottomed. However, he cautions that this bottom may not hold without accelerated institutional buying. He also warned that if institutional buying does not accelerate, it may not take long for Solana to print new lows.