Solana rebounds from a month-long slide, breaking the first Fibonacci resistance as traders watch for the next leg up.
Solana is trying to rebuild momentum after a bruising month-long slide, currently changing hands at $141.87. Over the last 24 hours, $SOL has gained about 3.6%, as buyers push price back toward the upper end of its recent $135–$144 range. On a 7-day view, performance is roughly flat with a mild 0.9% pullback that masks a clear dip-and-rebound pattern.
Meanwhile, the 14-day return shows a deeper 8.3% decline, while the 30-day picture is still harsh at around 30.3% in the red. With a market cap near $79 billion and daily volume above $5.8 billion, Solana remains highly liquid, setting the stage for a closer look at whether this rebound can evolve into a sustained recovery.
Can Solana Price Fully Recover?
On the technical end, the daily chart shows Solana is attempting a structured recovery from November’s sell-off. The auto Fibonacci retracement drawn from the recent swing high just above $205 to the low around $121.65 shows $SOL now pressing against the 0.236 level around the $141–$142 area. This marks the first meaningful resistance breach of the current bounce.

A confirmed move above this band would open the door toward the next Fibonacci levels at the 0.382 retracement at $153.60, where sellers are likely to re-emerge. If price fails to hold above the 0.236 band, downside focus returns to the recent base at $121, acting as major support.
Further, the Directional Movement Index (DMI) points to weakening bearish conditions. The +DI line at 13.26 sits well below the –DI line at 22.76, indicating that sellers are still present. The ADX above 45 suggests a strong trend, yet the narrowing distance between the two lines signals that bearish momentum may be losing strength. If the +DI line can flip the –DI line, it would signal a clear shift in momentum toward the bulls and strengthen the case for Solana extending its recovery.
Can Solana Outperform Bitcoin?
Elsewhere, with Solana finally recovering, a market watcher account, curb.sol, points to a breakout on the $SOL/$BTC pair. His chart on X shows the ratio pushing above a multi-month descending trendline, suggesting that Solana may be starting to outperform Bitcoin after an extended period of relative weakness. The chart points to a potential pump in the $SOL/$BTC pair toward roughly the 0.0035 to 0.0036 $BTC per $SOL area.
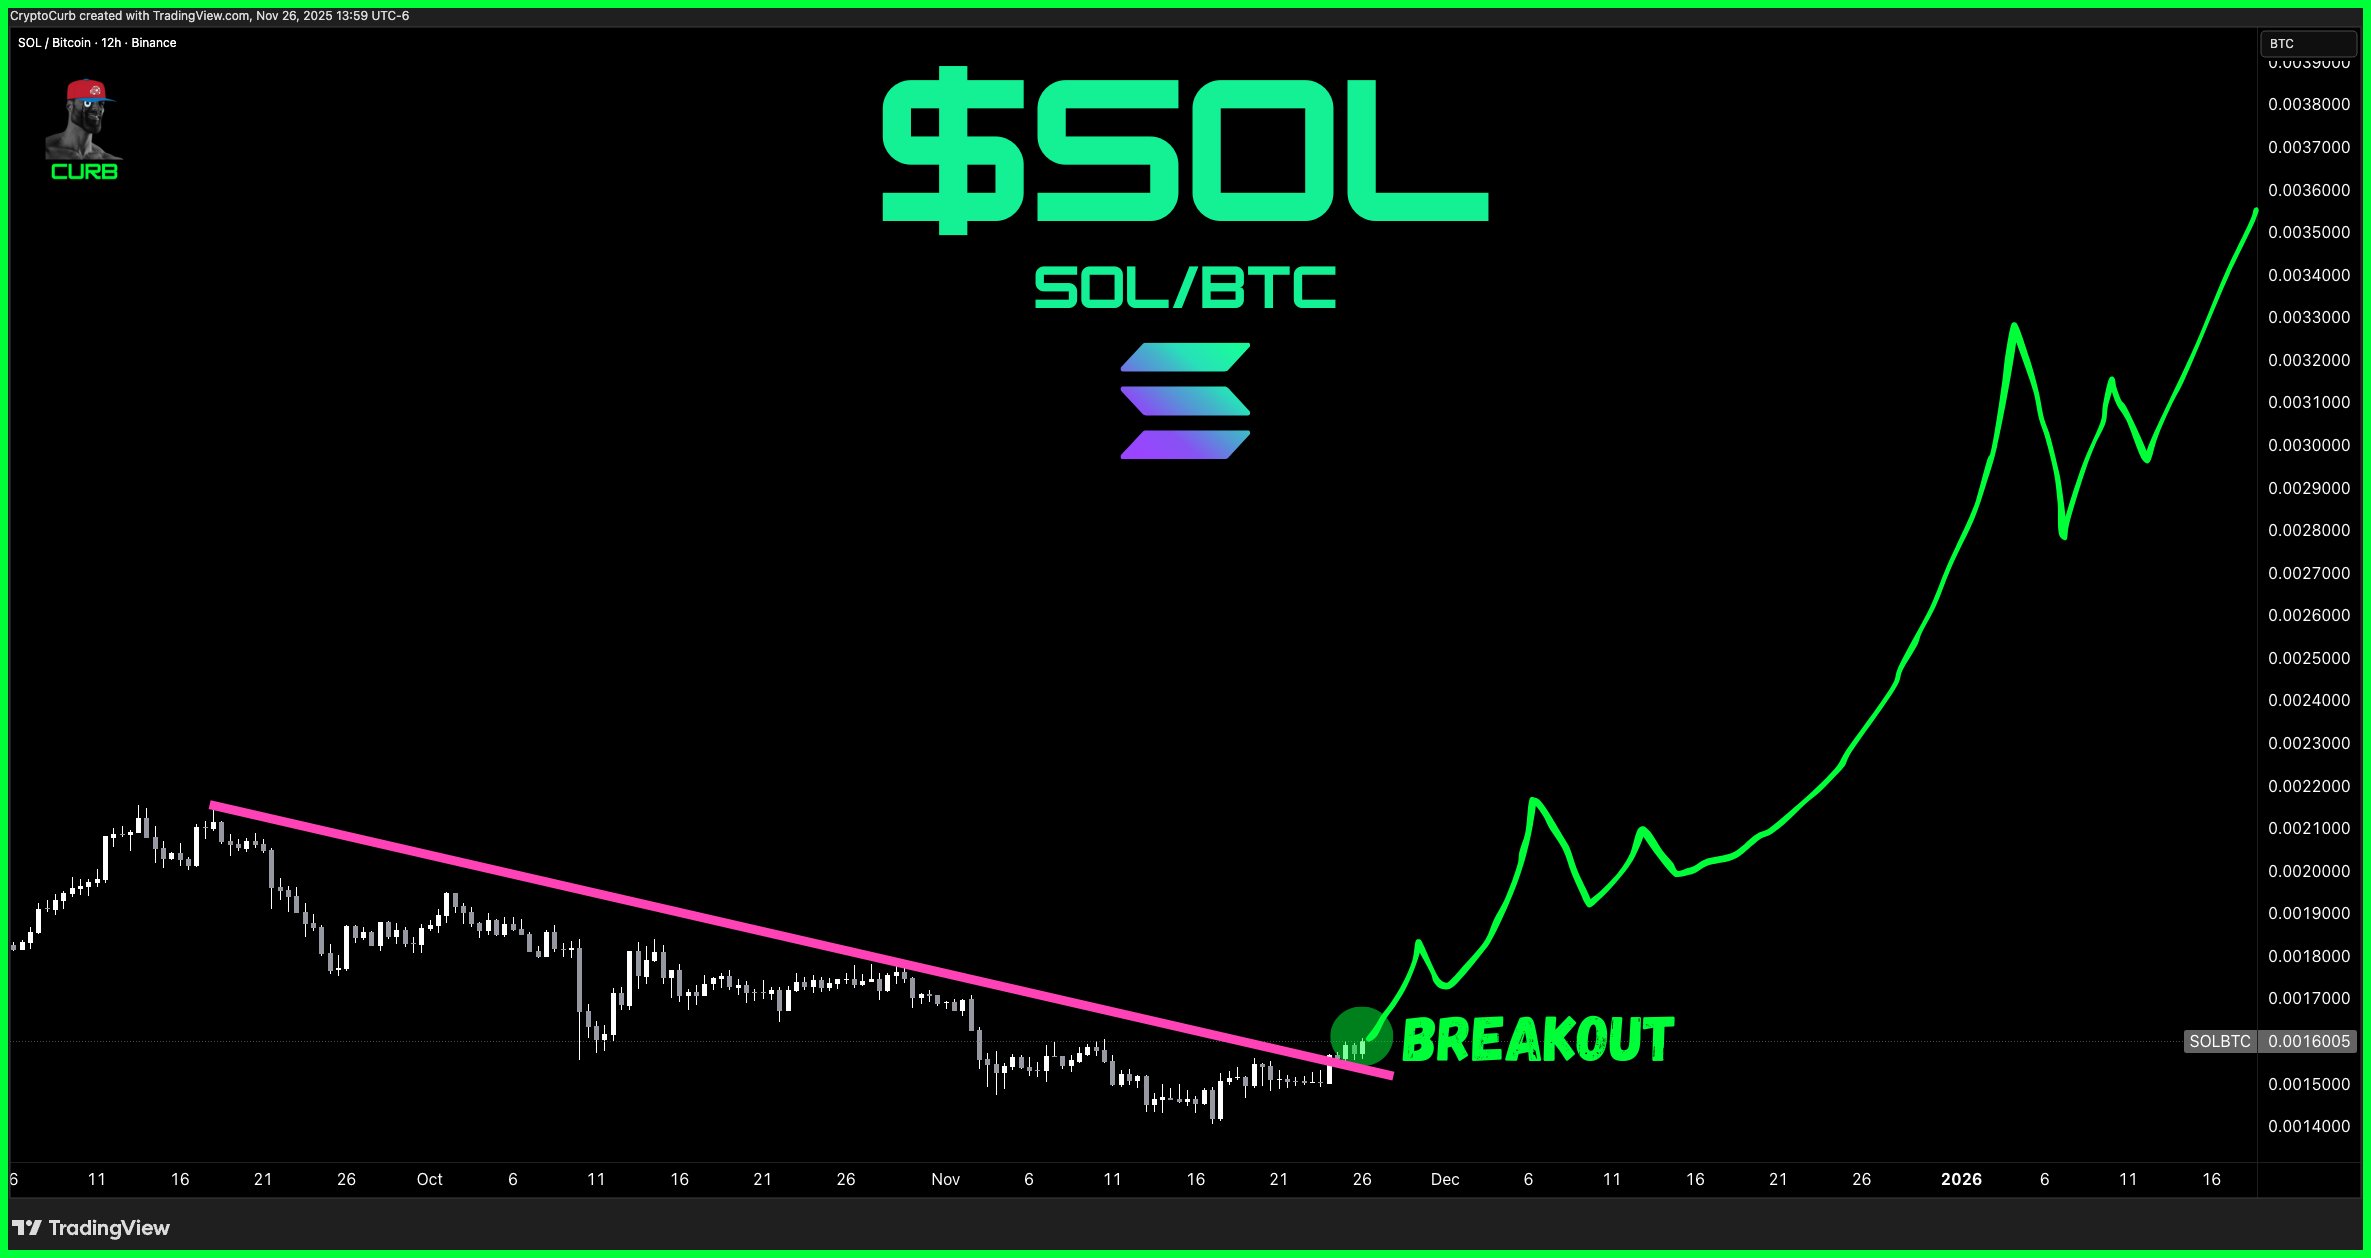
In his post, the market watcher calls the move “probably something” and even suggests that traders holding only $BTC should consider pivoting to $SOL. While the comment is speculative and not guaranteed, it underlines growing sentiment that Solana could lead the next leg higher if this breakout on the $SOL/$BTC chart holds.