
$XRP price remained in a technical bear market today, Nov. 26, after plunging by about 40% below its highest point this year.
- $XRP price has plunged by ~40% from its highest point this year.
- The 30-day $RLUSD volume has jumped by 56% to $3.5 billion.
- $XRP ETF inflows have jumped to $622 million.
Ripple ($XRP) token was trading at $2.15, up modestly from this month’s low of $1.8173.
$XRP has key stablecoin and ETF tailwinds
The $XRP price has remained under pressure in the past few months despite some notable bullish catalysts. One of these catalysts is the ongoing growth of Ripple USD ($RLUSD), its stablecoin.
Artemis data shows that its top metrics are doing well. For example, the amount of $RLUSD in circulation has jumped by 28% in the last 30 days to $1.2 billion. This makes it the third-biggest GENIUS Act-compliant stablecoin after USDC and PayPal’s PYUSD.
The number of $RLUSD stablecoin transactions rose by some 17% in the last 30 days to 443,000. Also, the adjusted transaction volume spiked by about 56% to $3.5 billion, a sign that people are using it.
While most of the $RLUSD supply is on the Ethereum (ETH) network, the one in the $XRP Ledger is seeing robust growth. It has jumped to almost $300 million in the past few months, a trend that may continue.
Meanwhile, American investors are accelerating their purchases of $XRP ETFs. SoSoValue data shows that these funds have not experienced a single day of outflows. Their cumulative inflows have jumped to over $622 million, while net assets are $644 million.
$XRP ETF assets account for about 0.50% of its market cap, suggesting they have more room to grow. For one, Ethereum funds account for 5.5% of its market cap, while Bitcoin (BTC) funds account for 6.54%.
$XRP price technical analysis suggests more pain
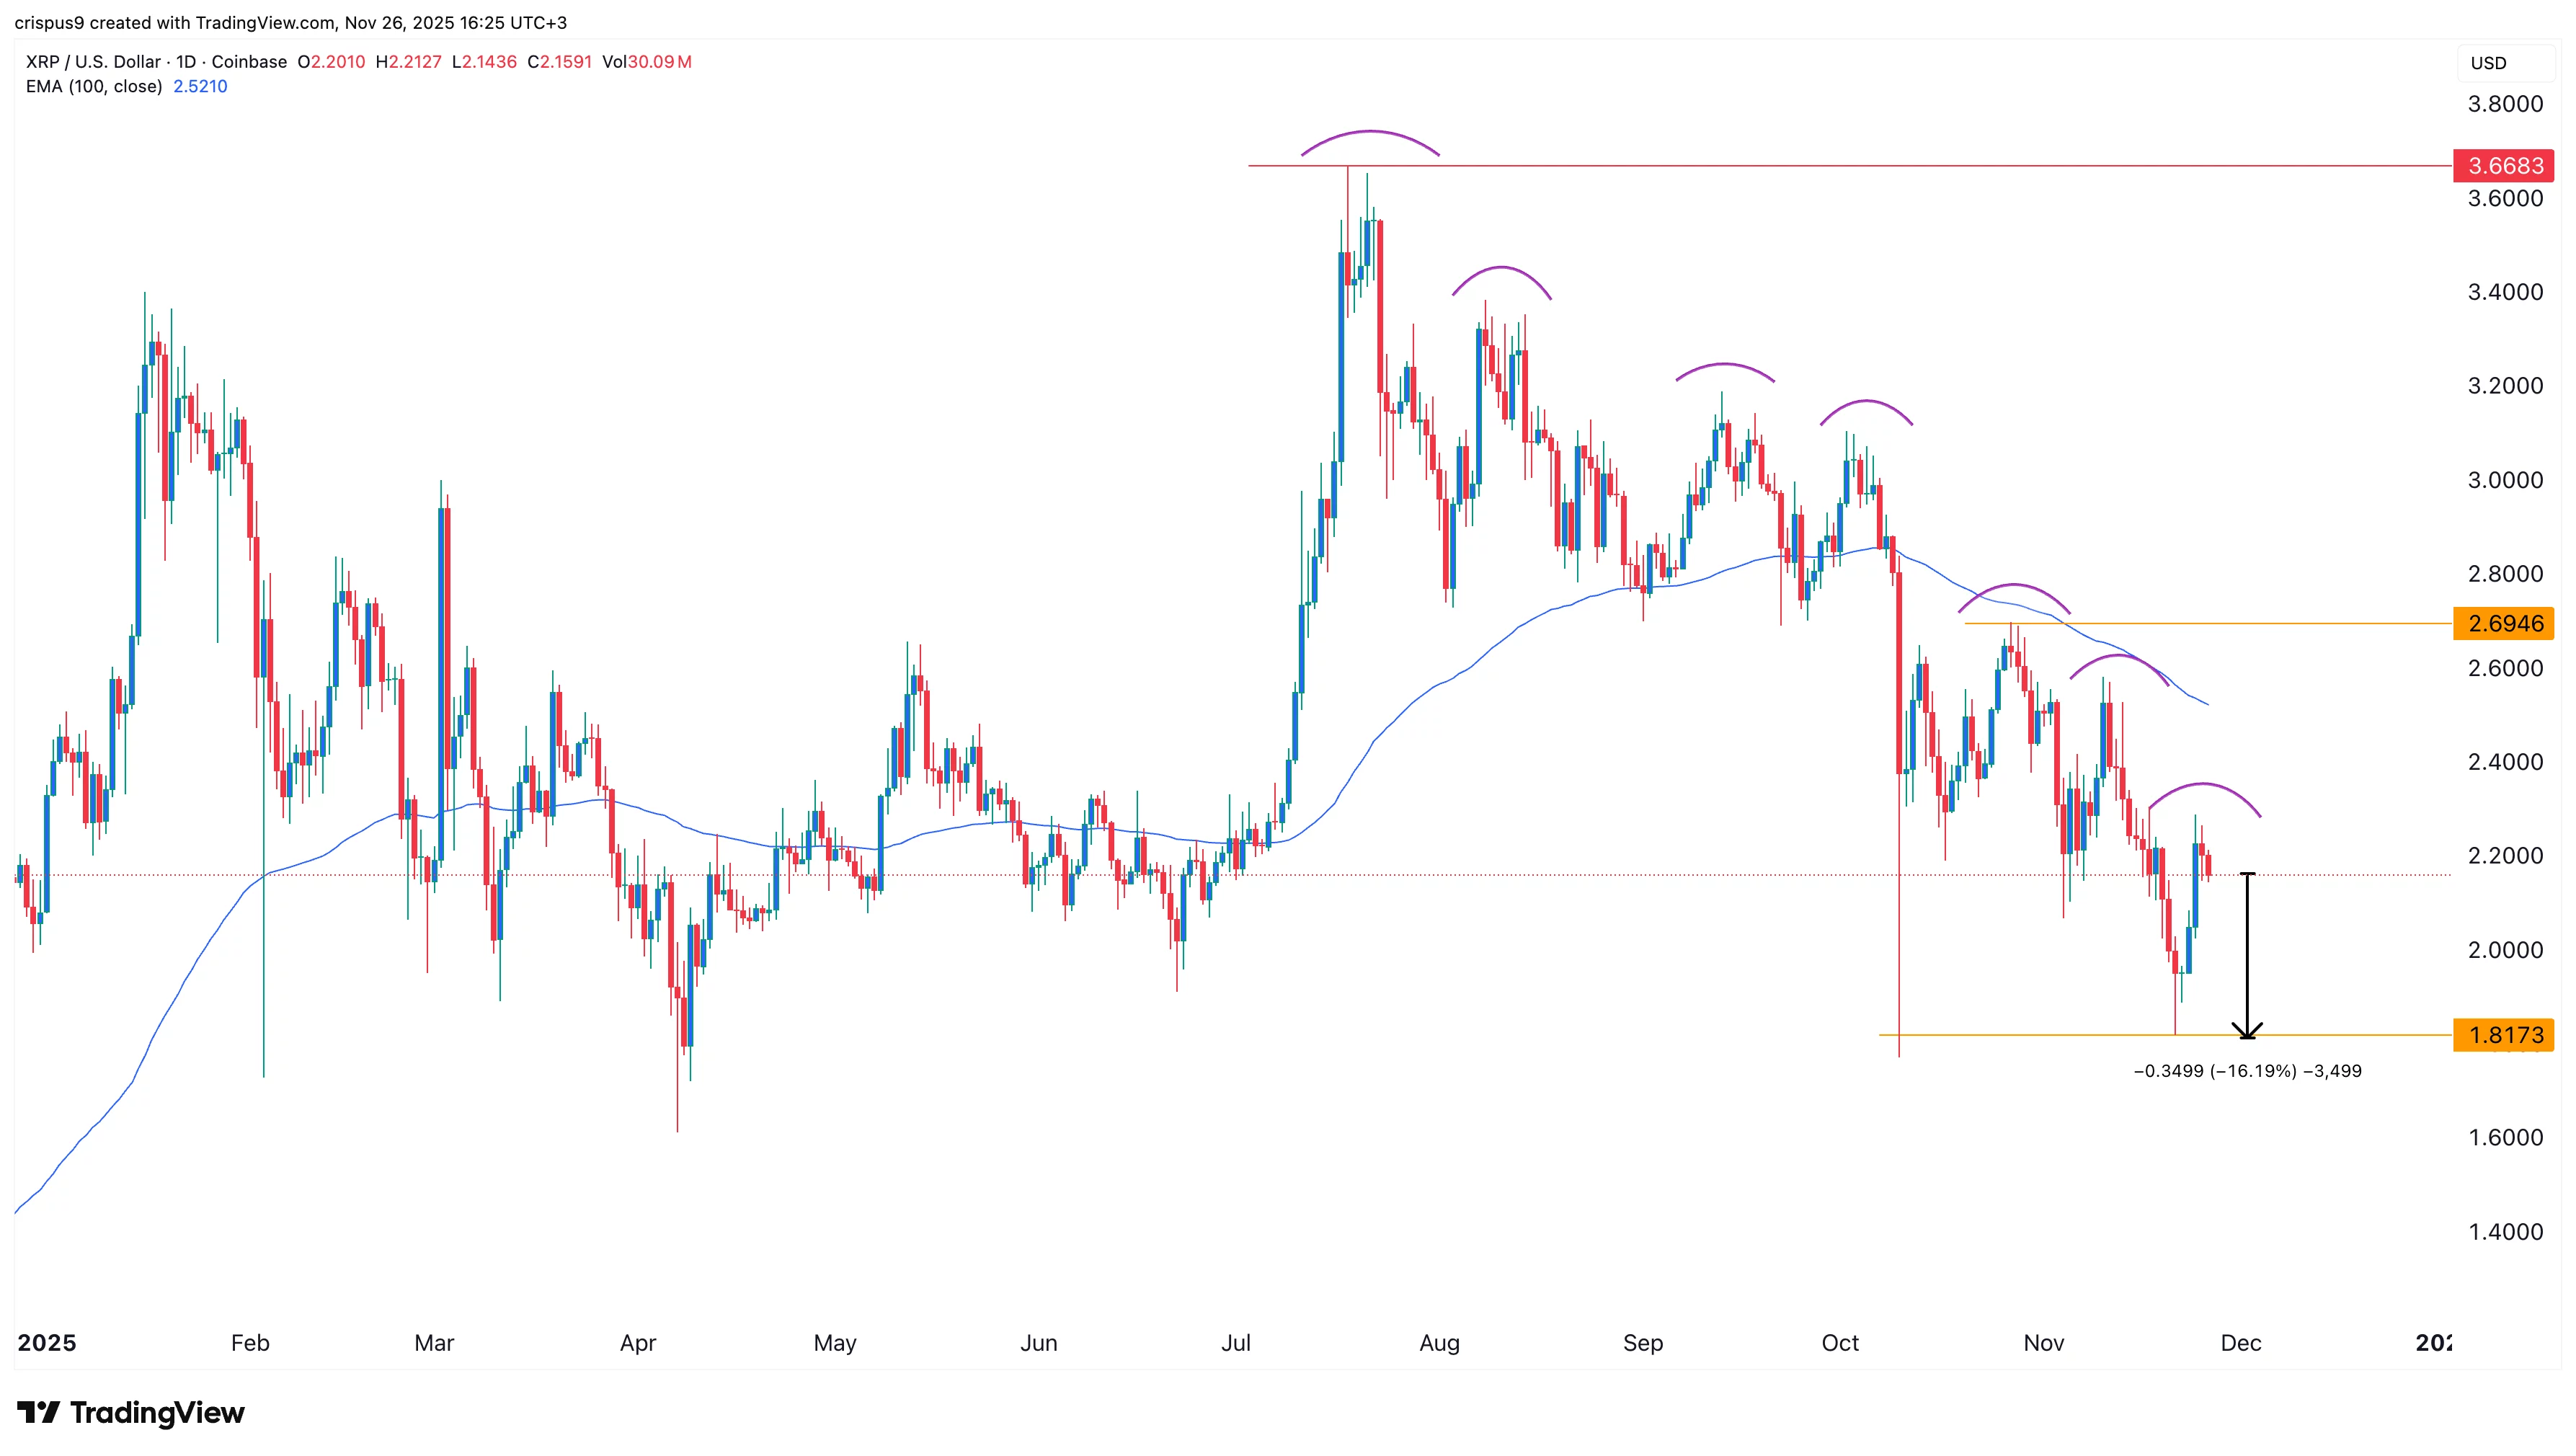
While Ripple price has bullish fundamentals, its technicals tell a different story. For one, the token has constantly remained below the 100-day Exponential Moving Average. It has also crashed below the Supertrend indicator.
Most importantly, a closer look at this chart suggests that it has been forming a series of lower lows and lower highs. This explains why its recent attempt to rebound has floundered.
Therefore, the most likely $XRP price forecast is bearish, with the initial target being at $1.8173, the lowest level this month and in October. This target is roughly 16% below the current level.