
Dogecoin faces downward risk, but a bullish divergence signal suggests potential for a reversal.
Notably, the Dogecoin (DOGE) price action reflects a significant downturn in the past 24 hours, with a 10.3% drop, bringing its price down to $0.1409. The sharp decline comes amidst broader market concerns that have also impacted other top crypto like Bitcoin. This price movement shows a steep fall from a peak of around $0.1589 earlier in the day.
Looking at Dogecoin’s performance over a longer timeframe, the meme coin has also faced a 13.7% drop over the past 7 days and a 26.3% decline in the last 30 days. This consistent downturn underscores growing investor caution, and analysts say further dip might be brewing. Dogecoin’s market cap currently sits at $21.44 billion, down 11.26% in the past 24 hours.
Dogecoin Price Analysis
On the technical end, Dogecoin’s weekly chart shows a strong downward trend, with volatility present as proven by the subsequent red candles. If the price continues to decline, it will test key Fibonacci retracement levels.
The 1 level (around $0.13001) is a critical support point, with further downside possible toward the 1.618 level (around $0.020). These levels remain important as they represent areas where the price could either find support or continue its decline if the bears break them.

The Stochastic RSI is at an extreme oversold condition, with the blue %K line at 0.00 and the orange %D line at 1.44. This suggests that Dogecoin could be nearing a bottom or reversal point, as oversold conditions often precede a bounce. The sideways movement of the lines indicate possible consolidation and reversal.
Overall, the chart shows a bearish trend, but the price is nearing potential support zones, and with the Stochastic RSI indicating oversold conditions, there could be a reversal soon. Traders should watch how the price behaves around the 1 Fibonacci level for signs of a reversal or further decline if support fails.
Can Dogecoin Reverse?
Elsewhere, a commentator on X points out a bullish divergence on the Dogecoin daily chart, which typically marks the end of a downtrend.
For the uninitiated, a bullish divergence occurs when the price of an asset makes lower lows, but the Relative Strength Index (RSI) forms higher lows. This suggests that while the price is still declining, the selling pressure is weakening, and a potential reversal to the upside could be imminent.
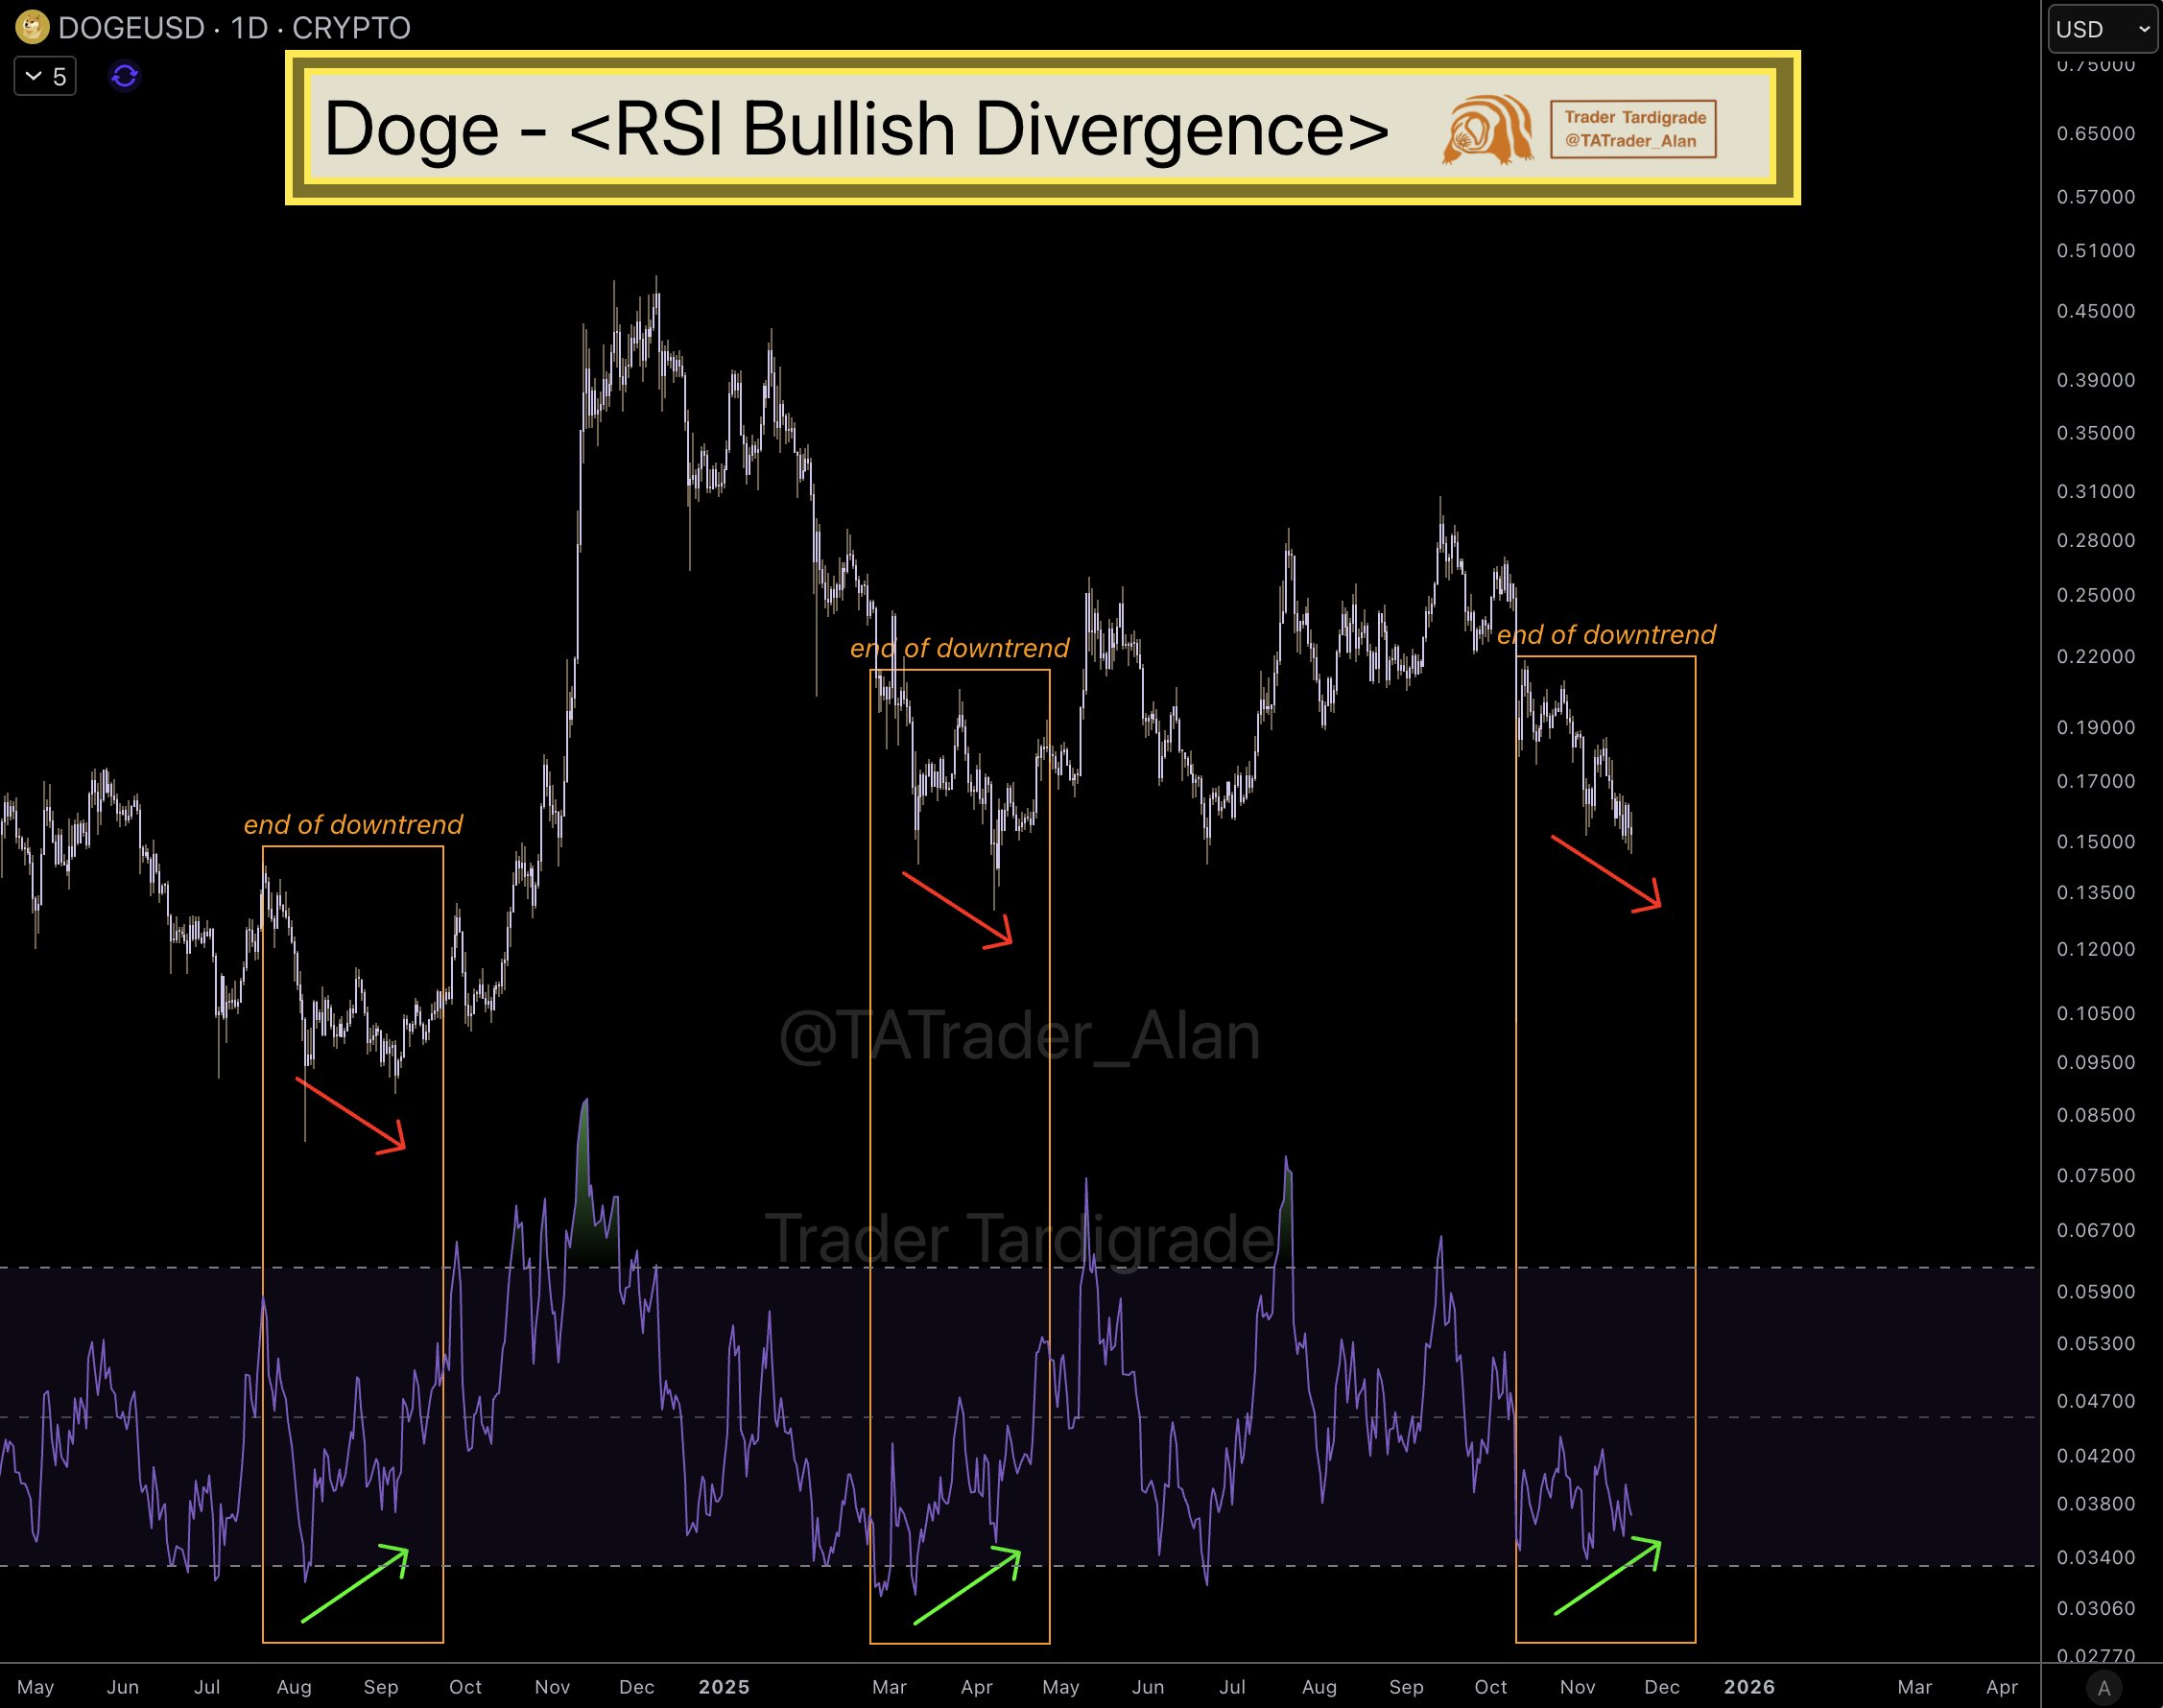
His chart highlights three key periods where this bullish divergence occurred and marked the downtrend bottom. Specifically, the first instance appeared between August and October 2024, where Dogecoin’s price made lower lows while the RSI rose. This marked the bottom, with DOGE recovering afterward to above $0.45.
Meanwhile, the second divergence came up around March to May 2025, with price continuing to drop but the RSI forming a higher low. This again marked the bottom and led to a surge from below $0.13 to levels above $0.25. Now, another divergence has occurred, suggesting that the bottom may be close.