
Recent data shows that Chainlink ($LINK) has established strong buyer interest around the $16 level. On October 19, more than 54.47 million $LINK were acquired, according to a cost basis heatmap shared by Ali Martinez.
At press time, $LINK was trading at $18, with a 24-hour decline of 5% and a weekly loss of 3%. Daily trading volume stands at $1.05 billion.
$16 Identified as Heavy Accumulation Range
The cost basis heatmap highlights a dense concentration of wallet activity at $16. This level now marks a key reference zone on the chart. The visual shows a strong horizontal cluster, which reflects a high number of tokens changing hands in that range.
The accumulation suggests market participants see value at this level. A large volume of tokens held here may reduce selling pressure, especially if prices return to that zone. Ali Martinez described the area as a “strong support zone,” based on the size of the holdings.
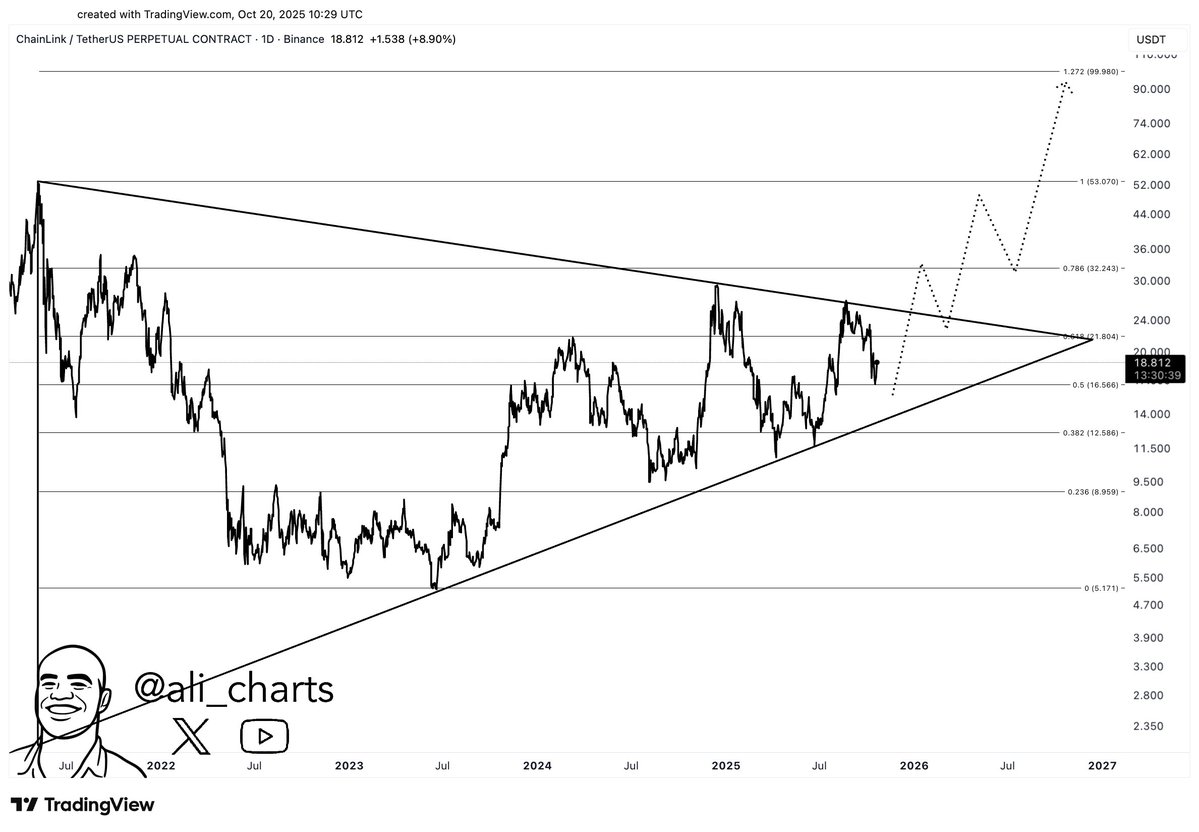
A separate chart from Ali shows a long-term triangle pattern with price squeezing between rising and falling trendlines. $LINK is currently positioned around the middle of the formation.
The analyst noted:
“The next time Chainlink breaks $25, it could ignite a bull rally to $100.”
Fibonacci projections on the chart show possible continuation levels at $32, $53, $74, and $99, if the price breaks out and holds above $25.
You may also like:
- Chainlink ($LINK) Faces Supply Crunch: Bullish Breakout Ahead?
- Chainlink Partners With SBI Group for Cross-Chain Tokenized RWAs
- Data Reveals Why Chainlink’s Rally Might Only Be Getting Started
Historical Price Action and Market Response
Past market behavior shows how $LINK responded to major downturns. In March 2020, during the COVID-19 crash, $LINK dropped 80% in one day. Over the next 15 months, it gained more than 3,700%, reaching above $50. This data was shared by Michaël van de Poppe, who noted how sharp declines can become recovery zones.
The COVID-19 crash was the lowest point in the previous cycle for many #Altcoins.$LINK went down 80% in a single night.
It did make a 3,700% since then in 15 months.
In hindsight, the largest crashes are the best financial opportunities. pic.twitter.com/eMb9AExWy9
— Michaël van de Poppe (@CryptoMichNL) October 20, 2025
After peaking in 2021, $LINK trended lower and found a base between $5 and $8 by late 2022. Since then, the price has remained mostly stable, with recent moves pushing it back near $18.
On-Chain Activity Supports Local Strength
Recent on-chain data from Santiment adds another view. When average 30-day returns for $LINK holders fall below -5%, price has often recovered shortly after. The firm noted this level was reached again on Friday, suggesting renewed accumulation.
Earlier this month, wallets holding between 100,000 and 1,000,000 $LINK added 1.38 million tokens during a short pullback. The ongoing interest from larger holders adds weight to the current support zone.