The crypto market is bleeding today, with $BTC down over 2.5% in the past 24 hours and altcoins taking the hardest hit—many losing double digits—as bearish sentiment spreads and liquidations top $1.5B.
- Over $1.5B in leveraged positions were liquidated in the crypto market today, intensifying the sell-off and dragging total market cap below $3.83T.
- Bitcoin, Ethereum, and altcoins, including $XRP, $BNB, $TON, and $WLFI fell sharply, with $XRP and $TON testing key support levels, $BNB cooling off from the recent rally to $ATH, and $WLFI giving back recent gains.
The crypto market dipped sharply over the past 24 hours, down 3.77% and adding to a 3.3% loss for the week. The total market cap slipped below $3.83T, putting pressure on major coins. At press time, Bitcoin ($BTC) is down about 2.6%, Ethereum (ETH) has fallen roughly 6.4%, and most altcoins are seeing double-digit losses.
The sell-off comes as the initial optimism from the Fed’s recent rate cut fades and liquidations from overleveraged positions continue to weigh on sentiment. Over $1.5B in bullish positions were liquidated today, according to Bloomberg, hitting smaller tokens the hardest.
Cryptocurrency traders saw more than $1.5 billion in bullish wagers liquidated on Monday, triggering a sharp selloff that hit smaller tokens hardest https://t.co/ZVxqhObkrH
— Bloomberg (@business) September 22, 2025
Let’s take a closer look at how some of the major altcoins are holding up and what the charts are showing.
$XRP
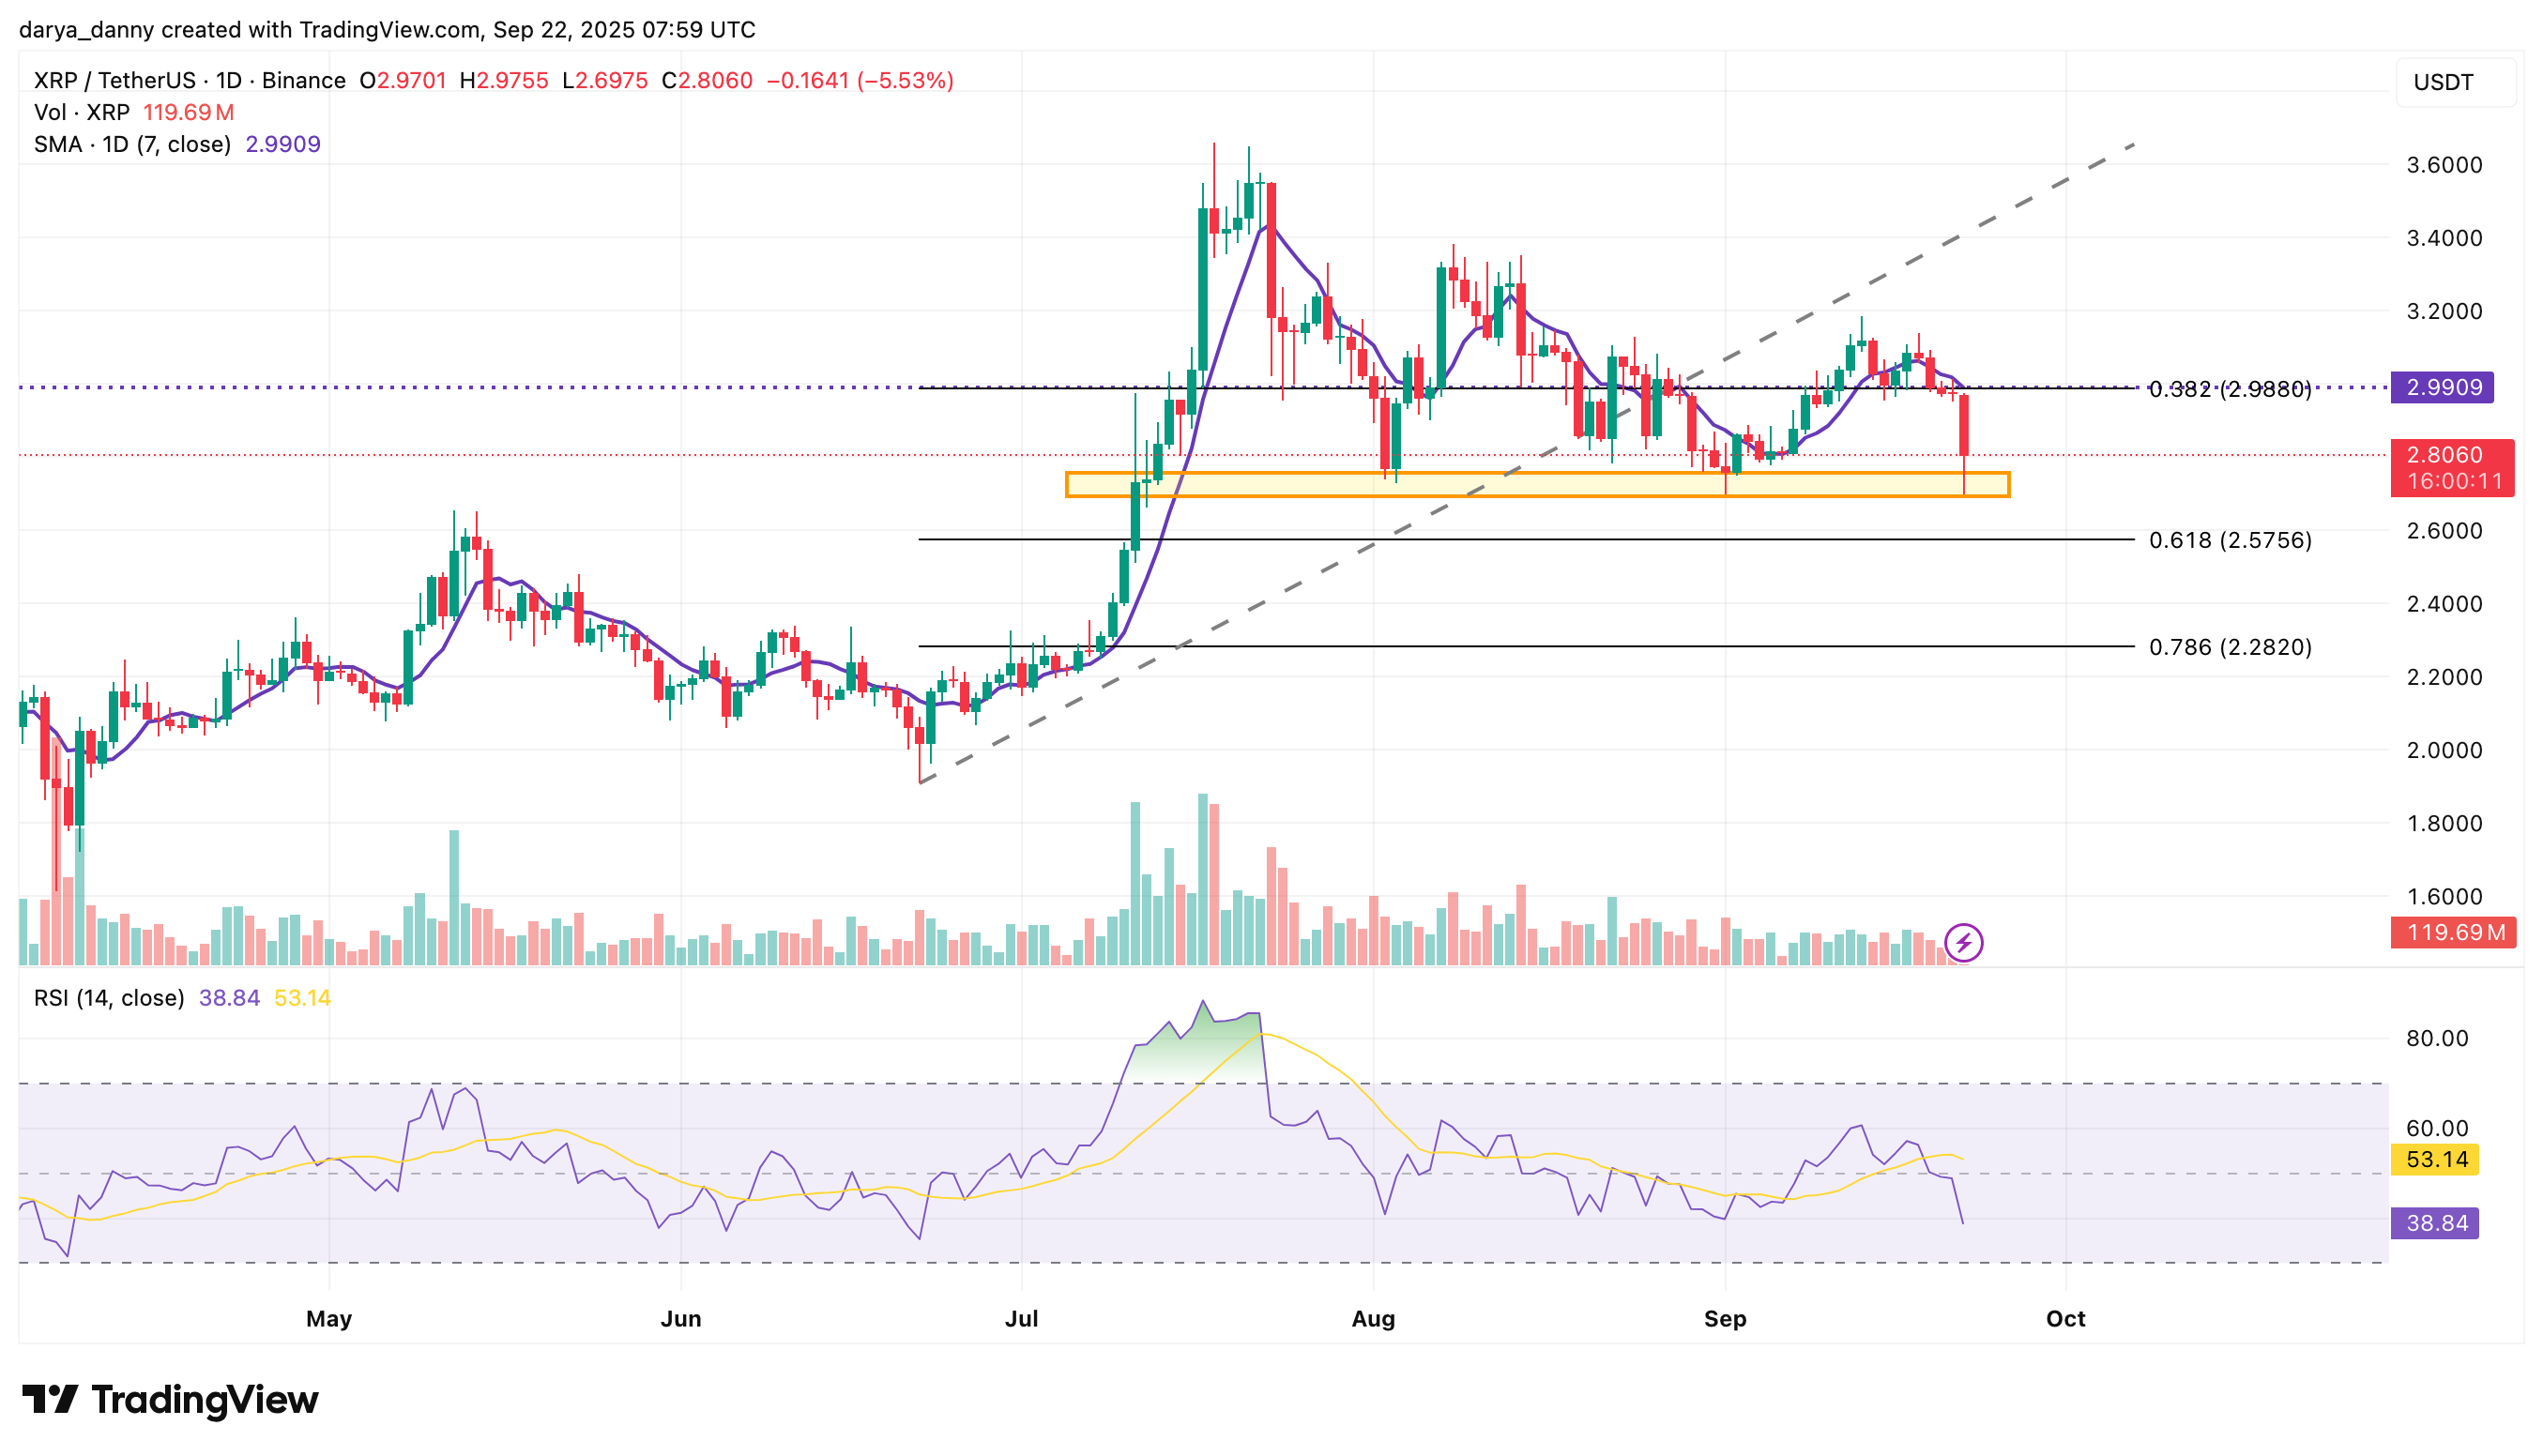
Ripple ($XRP) faced a sharp sell-off today, dropping nearly 9% intraday from the opening price of $2.97 to a low of $2.70. The retracement marked a breakdown below the confluence of the 0.382 Fibonacci retracement level and the 7-day EMA and bringing the price to retest a key horizontal demand zone between $2.70 and $2.85.
While buyers stepped in to defend this area, this retest is significant as this zone has served as a strong base since July. If this zone fails to hold, the next major level to watch lies at the 0.618 Fibonacci retracement near $2.6. The RSI is currently at 38, suggesting it has not yet entered oversold territory, leaving room for further downside.
 $BNB, $WLFI, $TON and $XRP prices crashing? - 1">
$BNB
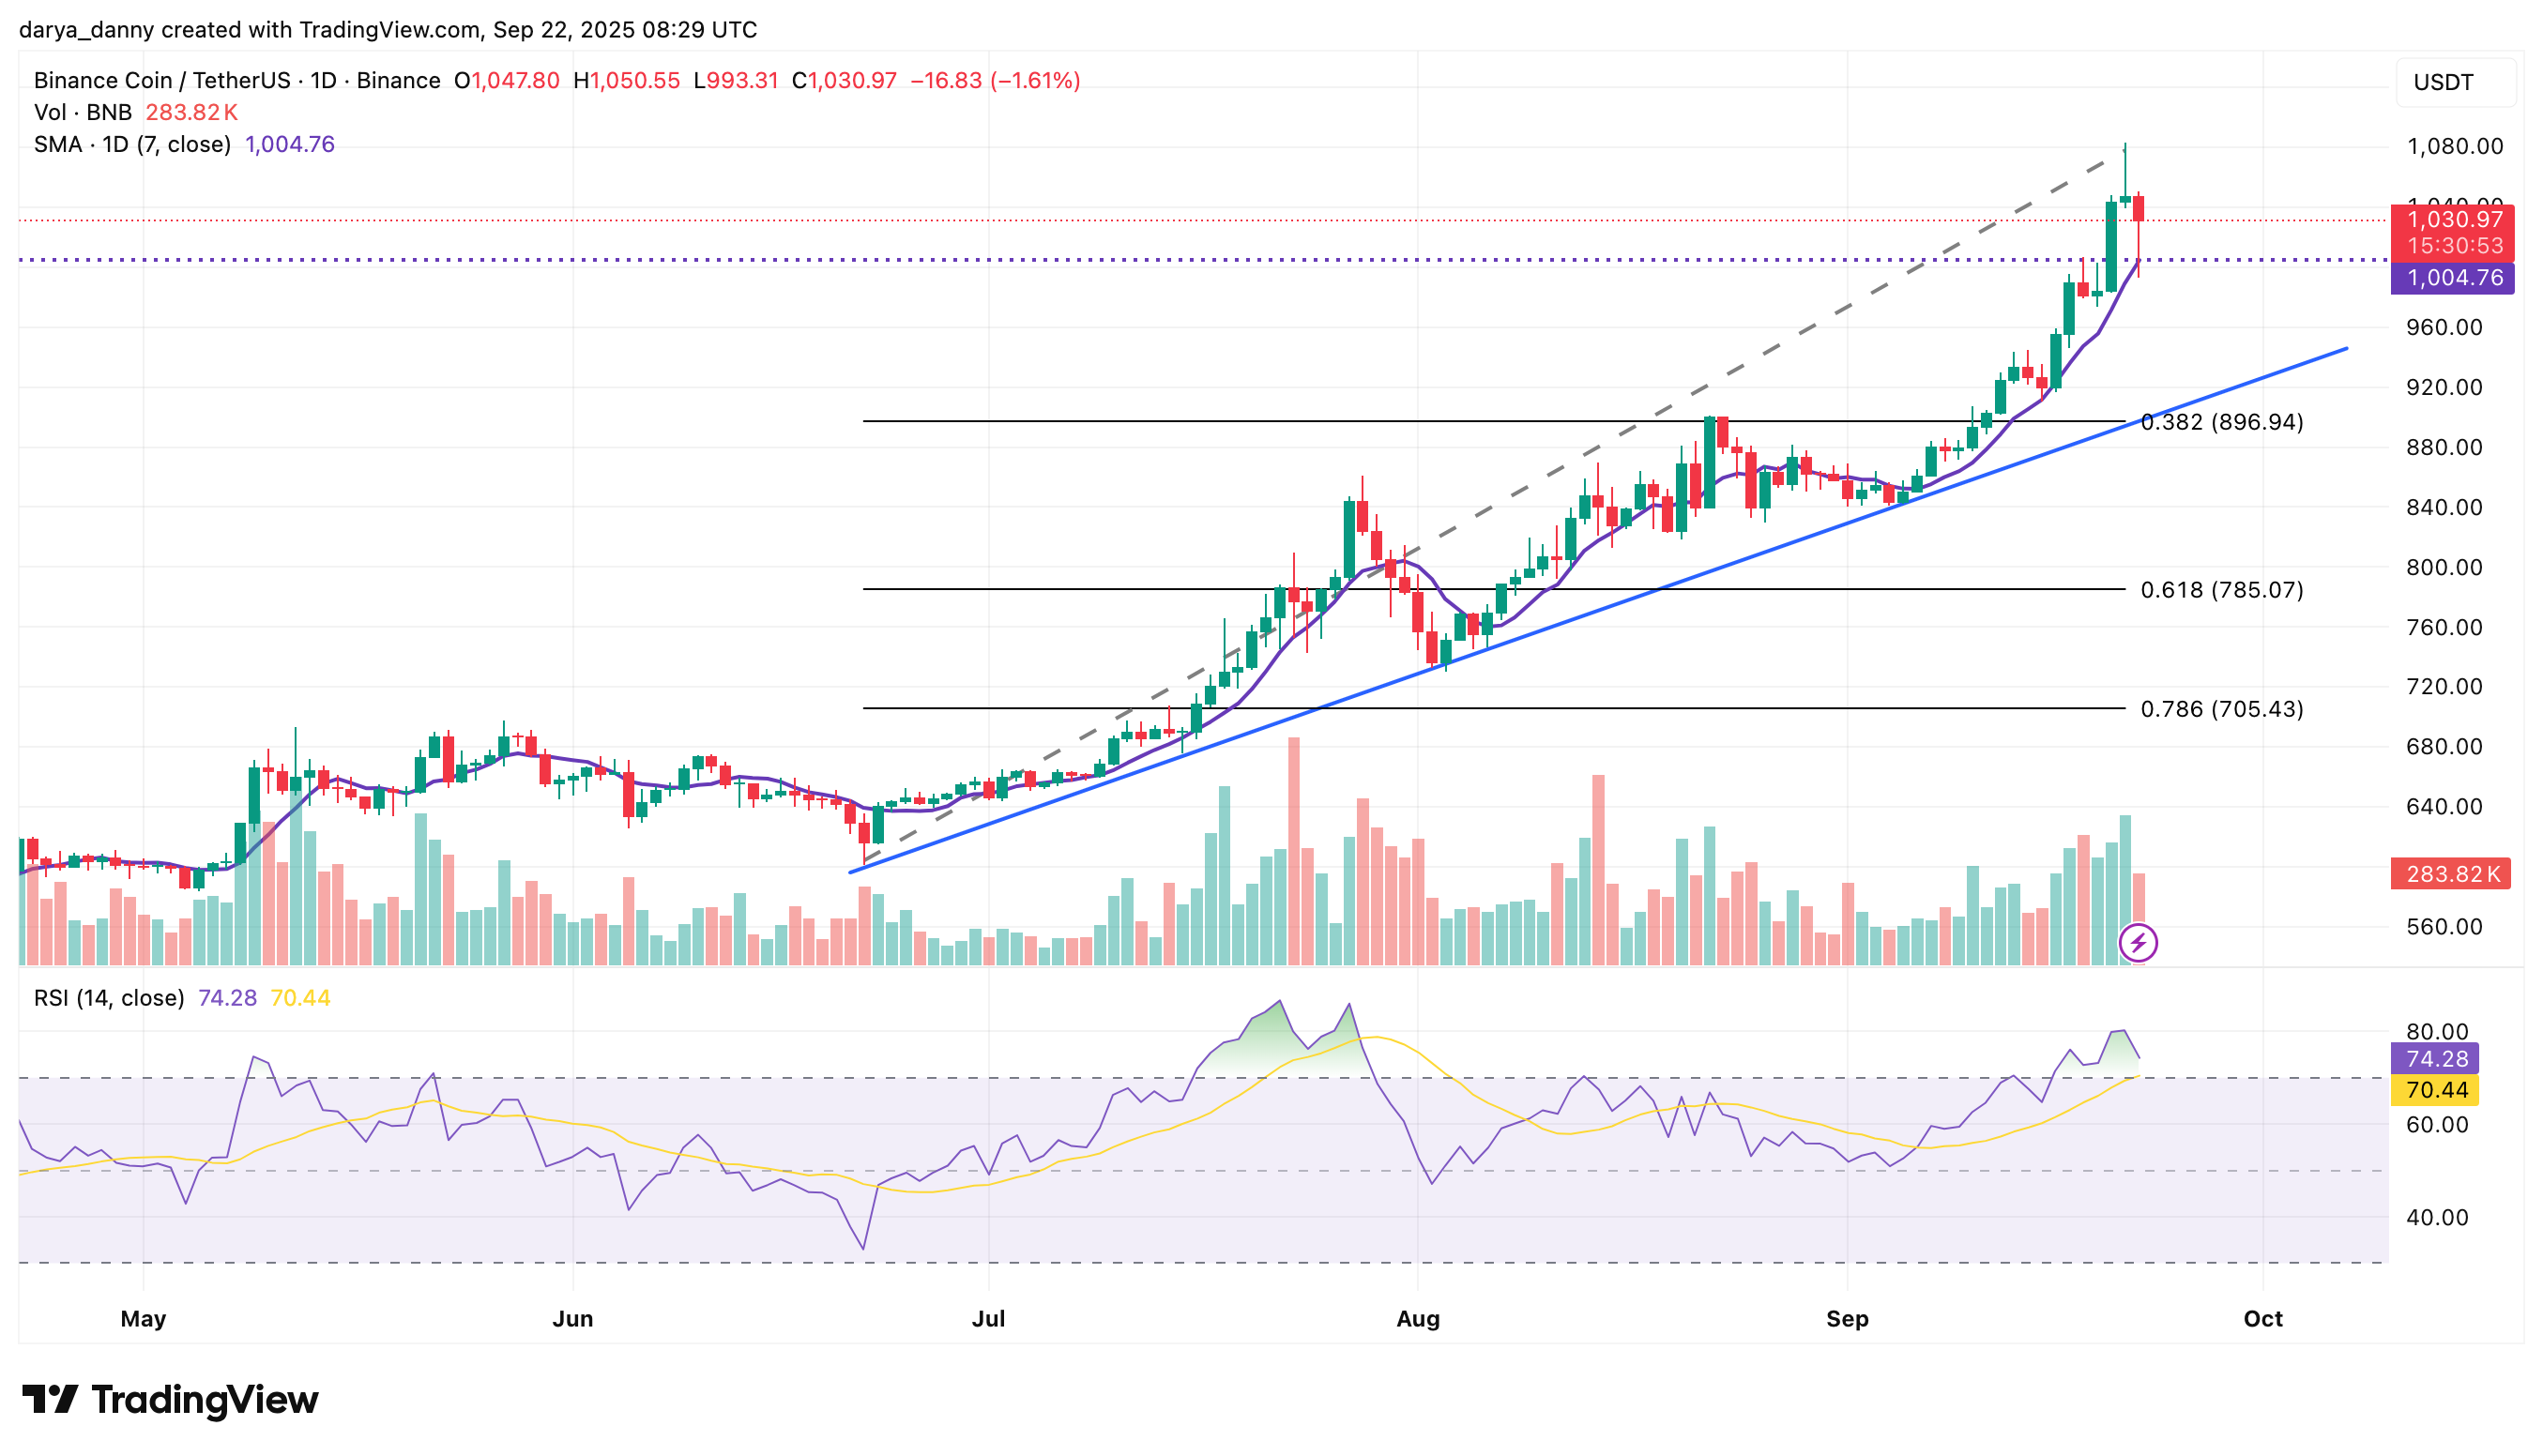
Binance Coin ($BNB) price extended its uptrend this week, reaching a new $ATH of $1,083 yesterday. However, the rally showed its first signs of cooling today, as the price pulled back to an intraday low of $993, briefly dipping below the 7-day EMA. It has since rebounded and is currently trading back above the moving average at $1,030.
Today’s sell-off marks the first sign of cooling after a near-vertical ascent from the last retest of the rising trendline support. If the 7-day EMA fails to hold, the risk increases of a deeper pullback toward the ascending trendline, which aligns closely with the 0.382 Fib around $896. This trendline has been intact since June and has repeatedly acted as a launchpad for bullish continuation, making it a critical level to watch in the event of further downside.
$TON
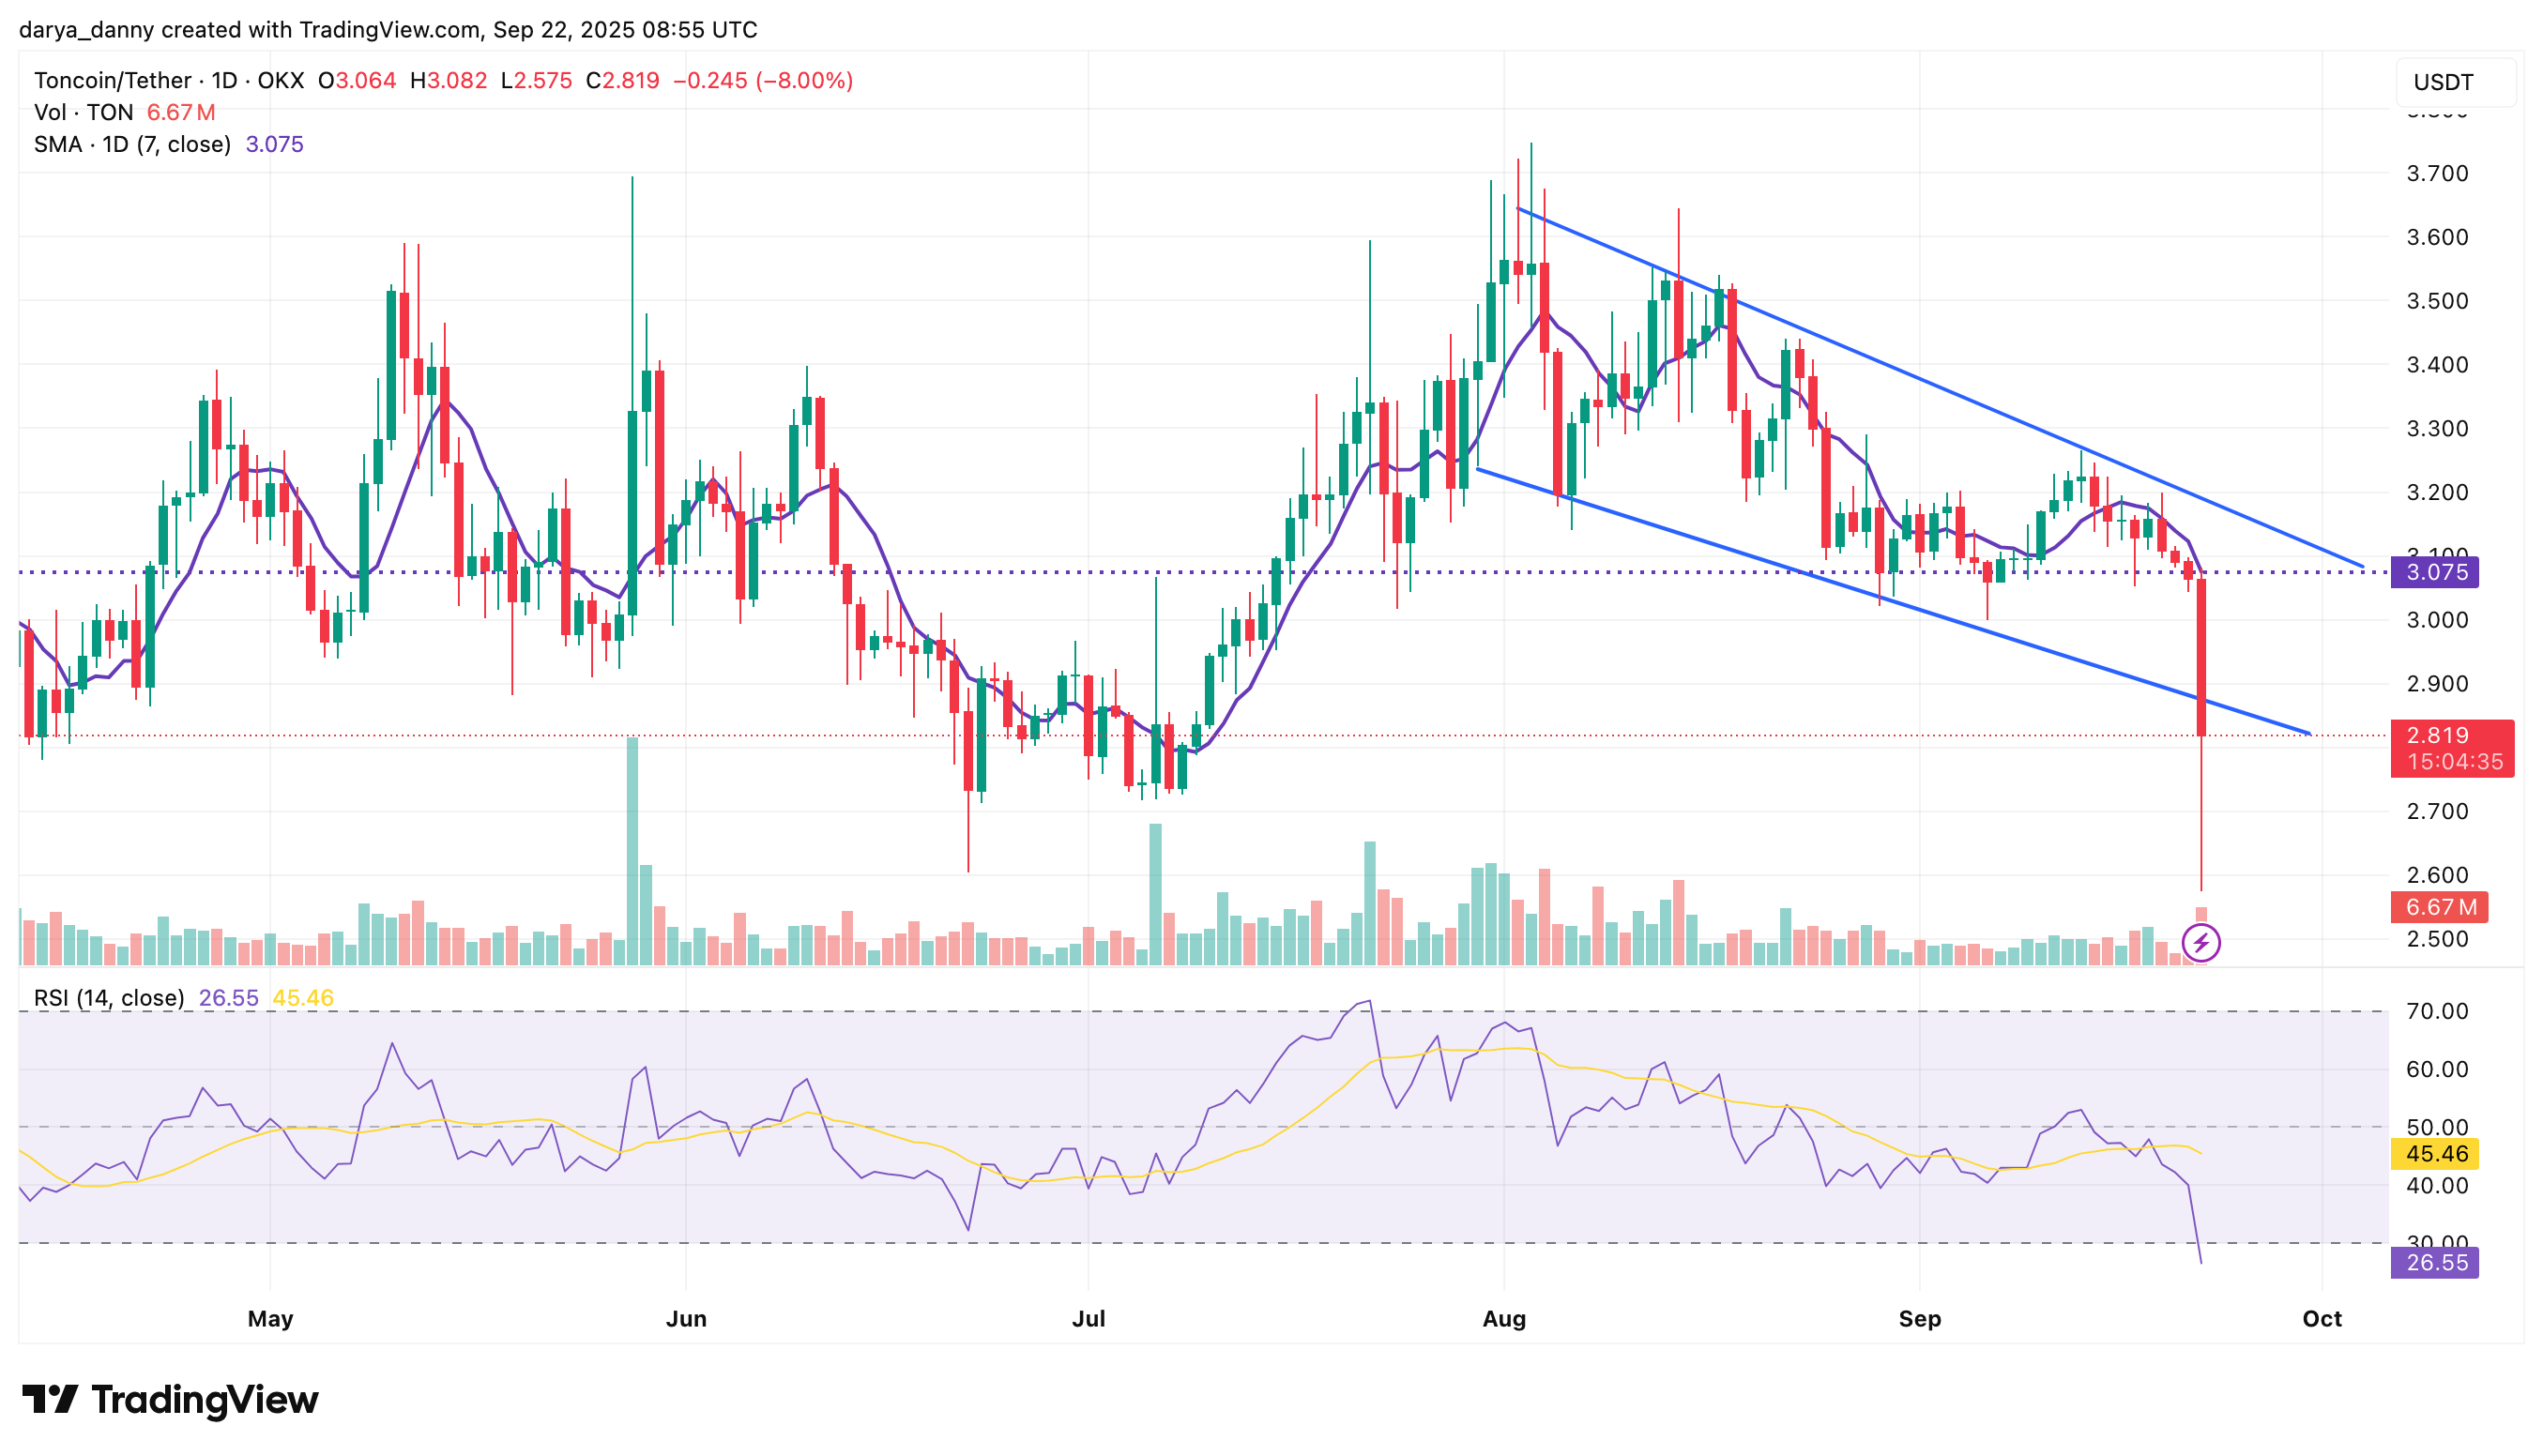
Toncoin ($TON) saw one of the steepest declines in the crypto market today, falling almost 16% from the opening price of $3.064 to an intraday low of $2.575, accompanied by a spike in volume. The sharp drop marked a clean breakdown below the descending channel that had contained $TON price action since late July.
The sell-off also pushed $TON well below its 7-day EMA, which now sits overhead at $3.07, while the price currently trades around $2.82. This MA may now act as a resistance on any relief bounce as price recovers from the oversold territory, with the RSI currently at 26. Unless $TON can quickly reclaim the lower boundary of the broken channel and stabilize within the structure, there’s a risk of further downside toward the $2.70 level, with the former trendline support potentially flipping into resistance.
$WLFI
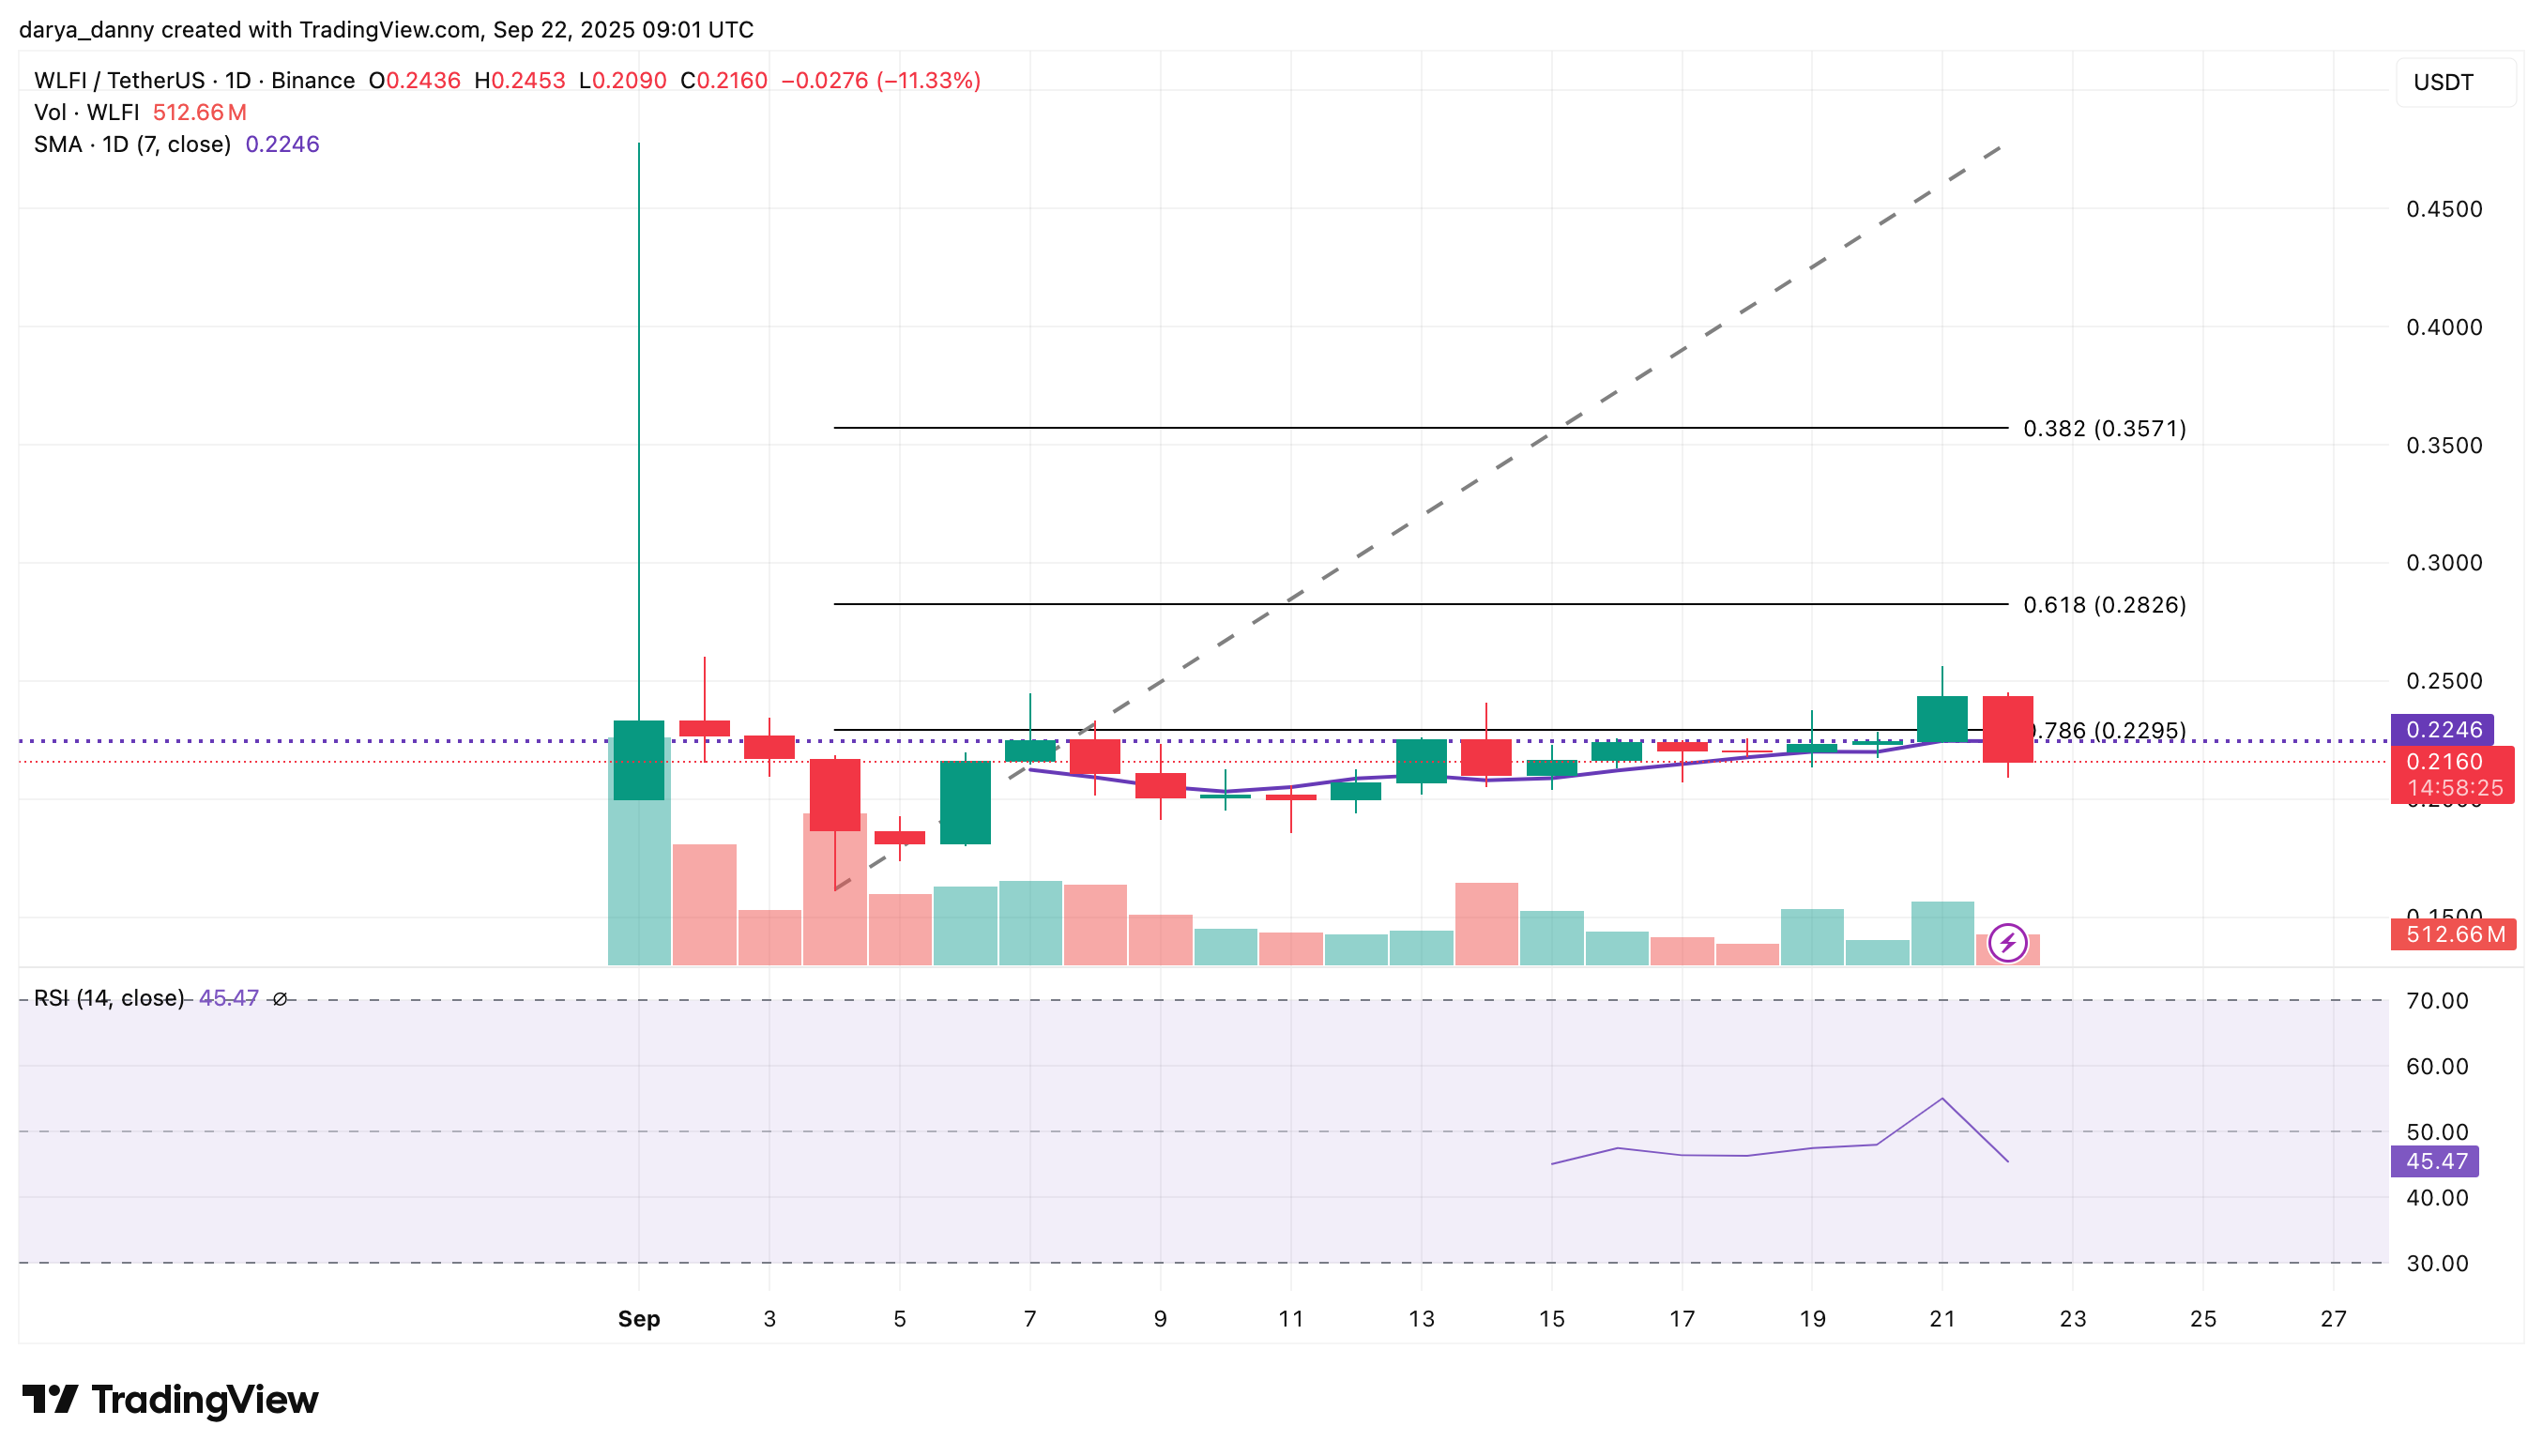
After a steady grind higher over the past week, World Liberty Financial ($WLFI) price followed the broader crypto market in a sharp pullback today, retreating by 11% from the opening price of $0.24 to an intraday low of $0.21, effectively erasing most of its recent gains. The decline came shortly after price briefly broke above the 0.786 Fib at $0.23, hinting at a potential breakout that ultimately failed to gain traction. The rejection from above the Fib level now appears to have triggered a wave of profit-taking, with momentum quickly shifting to the downside.
The RSI on daily and 4-hour timeframes reflects this bearish turn as it has dropped below 50, to 45 and 42 respectively. This leaves room for further downside, potentially toward previous support at $0.18, if bulls fail to hold the critical $0.20 level.