cryptopolitan.com

- Polkadot price rose 10 percent on the day to move as high as $20.28
- Price targets $28.47 resistance zone with an expected 15 percent upturn
- In case of a bearish takeover price must go down to $16.89 to invalidate bullish thesis
Polkadot price analysis for the day shows bullish signs, as price took a swift upturn to move past the $20 mark. $DOT seemed to have failed to test the current level on February 2, when price declined down to $18.01, but an immediate change in trend followed during the day’s trade. Polkadot could be in line for a further increment of up to 15 percent to take price up to the resistance point at $28.47, however the next hurdle is expected at $22. At current trend, $DOT presents an ideal buying opportunity where profits could be booked within the $22 and $24.18 range.
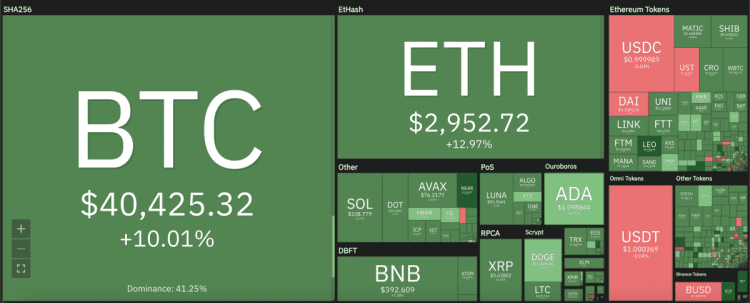
The larger cryptocurrency market picked up massive increments over the day’s trade, led by Bitcoin’s ascend above the crucial $40,000 mark with a 10 percent increment. Ethereum followed suit with a 13 percent rise, taking price up to $3,000. Among Altcoins, Ripple and Cardano gained 6 and 5 percent, respectively, while Solana upped more than 12 percent to take price up to $108.779.
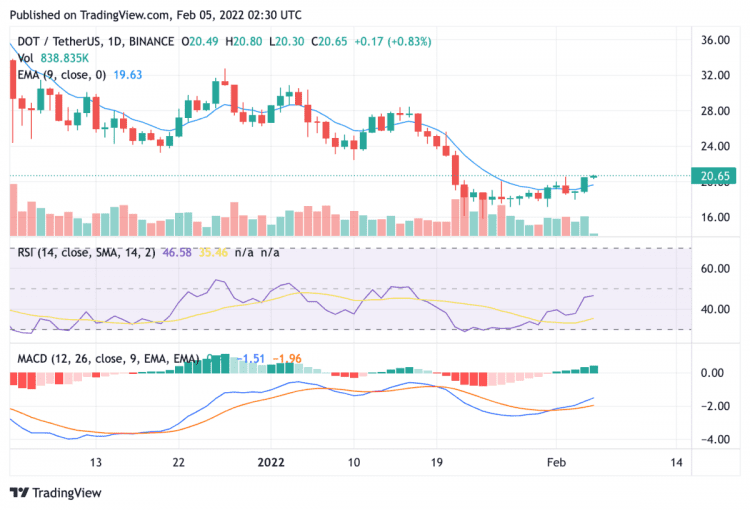
$DOT/USD 24-hour chart: Increasing market value tips for current trend to continue
The 24-hour candlestick chart for Polkadot price analysis shows price rising above the crucial 25 and 50-day exponential moving averages (EMAs) during the day’s trade. $DOT gained more than 10 percent to build momentum towards the initial testing point at $22, with further movement upward expected to take price up to the $28.47 resistance. In case buying pressure continues, Polkadot can cut the supply zone to test the 50-day simple moving average (SMA) at $24.18 over the next 24 hours.
The relative strength index (RSI) in this case shows favourable market valuation for $DOT, sitting at an increasing value of 46.15. The moving average convergence divergence (MACD) curve sets a similar view, crossing the neutral zone to set up bullish highs.
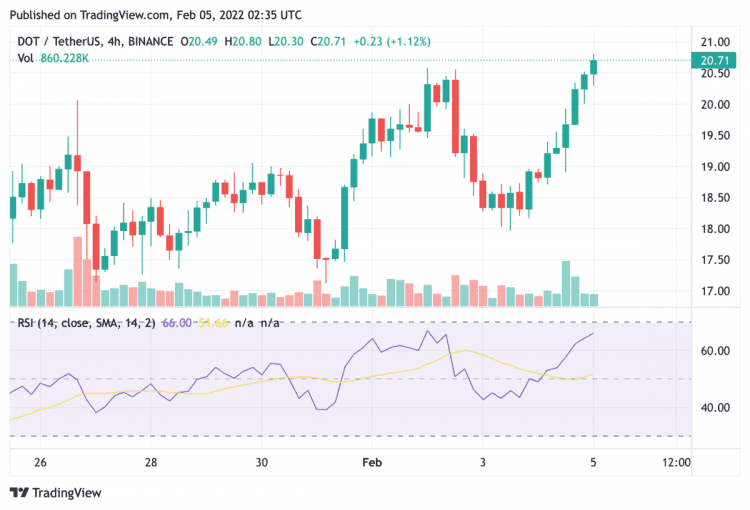
$DOT/USD 4-hour chart: Price vary of $16.89 support to intervene
In a converse scenario, the bullish thesis may be sidelined if $DOT 4-hour candlestick chart closes below the $16.89 support. This will create an opportunity for sellers to lower price down to $15.05 after attaining profits from current trade. In this scenario $DOT will have to push again to test the $20 mark. Current 4-hour stance for $DOT could be termed as overvalued in the market, with the RSI value sitting above 66, hence buyers need to be vary of a quick turnaround.