cryptopolitan.com

- Dogecoin price ascended from the $0.128 support to consolidate above $0.14 demand zone
- Price remains bullish and on course to rise as high as $0.194 before profit taking initiates
- A 24-hour close below $0.128 will invalidate the bullish momentum
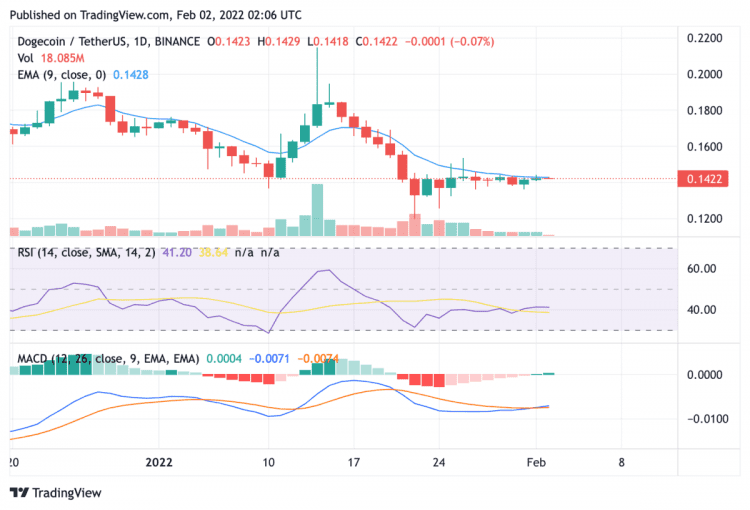
Dogecoin price analysis is bullish today, with the token consolidating above the $0.128 support zone during the day with a slight increase. Price ascended as high as $0.1448 during the day to set up a potential increment towards $0.16. $DOGE crashed 35 percent after the decline that began on January 16, and maintained below the December 4 low at $0.128 till last week. After the downturn, the token has consolidated around $0.14 demand zone and further buying momentum could take price up to the 50-day simple moving average (SMA) at $0.16 over the course of the next 24 hours. There is also potential to reach up to $0.194 where the 100-day SMA sits.
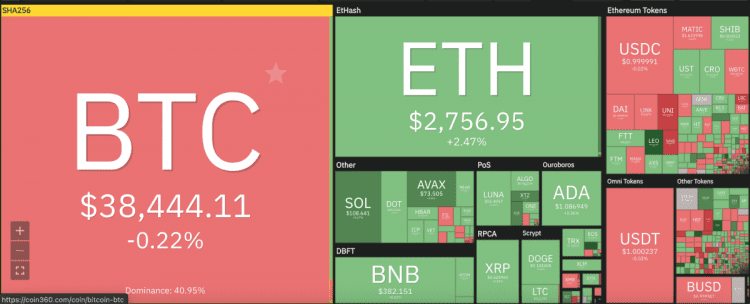
The larger cryptocurrency market showed largely bullish signs over the course of the day’s trade, with Bitcoin sitting just short of $38,500. Ethereum saw a 2 percent rise to reach back within touching distance of the $3,000 mark, whereas Altcoins also showed gains. Cardano increased 3 percent up to $1.08, Ripple 2.5 percent to $0.62 and Litecoin 4 percent to $113.66. Solana jumped up 9 percent to reach as high as $108.50 whereas Polkadot rose 3 percent to $19.98.
Dogecoin price analysis: 24-hour chart shows price gaining past crucial EMAs
The 24-hour candlestick chart for Dogecoin price analysis shows price touching the crucial 25 and 50-day exponential moving averages (EMAs) as a result of the day’s price action, where price continued to consolidate. The relative strength index (RSI) shows an increasing value of 41.27, showing increasing market valuation for $DOGE. The RSI is supplemented by the increasing number of 24-hour active addresses for $DOGE which have increased more than 213 percent since January 25, showing interest from traders. Similarly, the moving average convergence divergence (MACD) curve represents a healthy outlook for $DOGE, as it moved past its neutral zone over the past 24 hours.
Overall, major technical indicators suggest price has the potential to continue consolidation over the current trend around the $0.14 barrier. Any short-term buying surge could also take price further upwards to the next resistance point at $0.183, with potential also to hit the pre-January 16 decline level at $0.194. On the contrary, the bullish thesis will invalidate if price slips below the immediate support zone at $0.128 over the daily chart, which could trigger a decline towards $0.09.