
$BONK, the Solana-based meme coin, continues to stir excitement across the crypto community. After gaining traction during the meme coin frenzy earlier this year, $BONK's momentum cooled, leading to some sideways movement. However, with the recent shifts seen in the charts, traders are once again eyeing the coin closely. The big question is whether $BONK coin is setting up for another leg higher or if the recent pumps were just a short-term burst. Let's break down the price action on both daily and hourly timeframes to see what may lie ahead.
Is $BONK Gearing Up for a Bullish Breakout? (Daily Chart Analysis)
 $BONK Price Prediction">
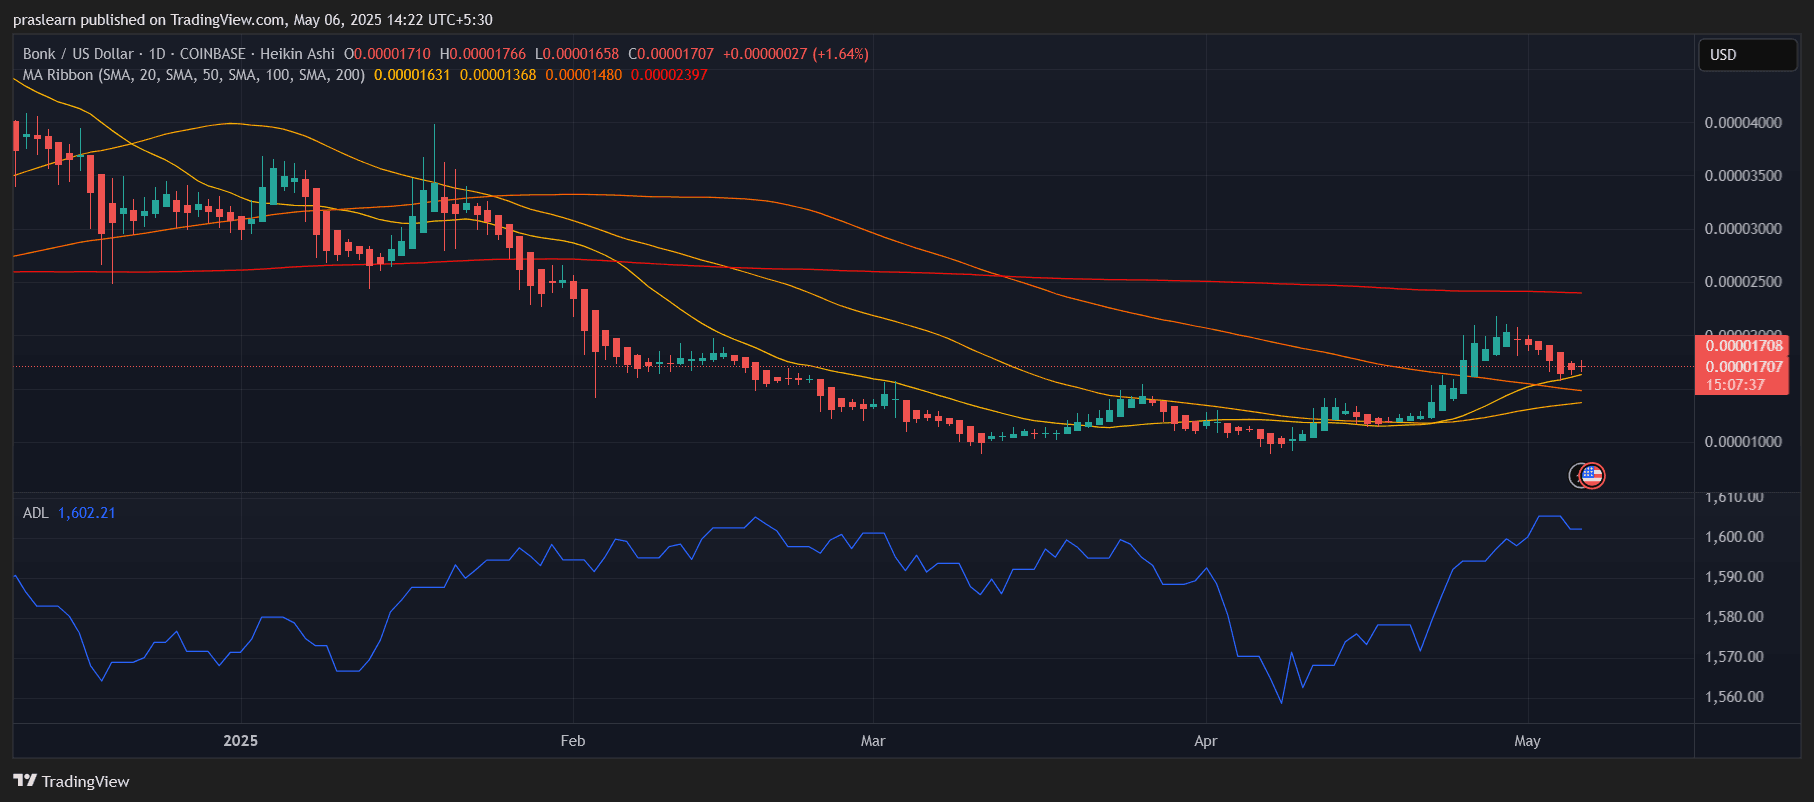
The daily chart shows $BONK currently trading around $0.00001708. The price has steadily climbed since early April, forming higher lows, and is now testing a key resistance zone. What’s noteworthy is $BONK’s ability to close above the 50-day and 100-day simple moving averages (SMAs), which now lie near $0.00001368 and $0.00001480, respectively. This crossover is a traditionally bullish signal and hints at growing strength.
However, the 200-day SMA looms overhead at approximately $0.00002397, which is acting as a longer-term resistance. The current price action has been slightly consolidative, forming what resembles a flag or pennant pattern—a classic continuation signal. If bulls can push $BONK price above the $0.00001850 level in the coming sessions, we may witness a sharp move toward $0.00002100–$0.00002300 in a matter of days.
The Accumulation/Distribution Line (ADL) is rising steadily, which confirms buying interest. This bullish divergence between price and ADL supports the potential for a breakout continuation.
What’s Happening in the Short Term? (Hourly Chart Analysis)
 $BONK Price Prediction">
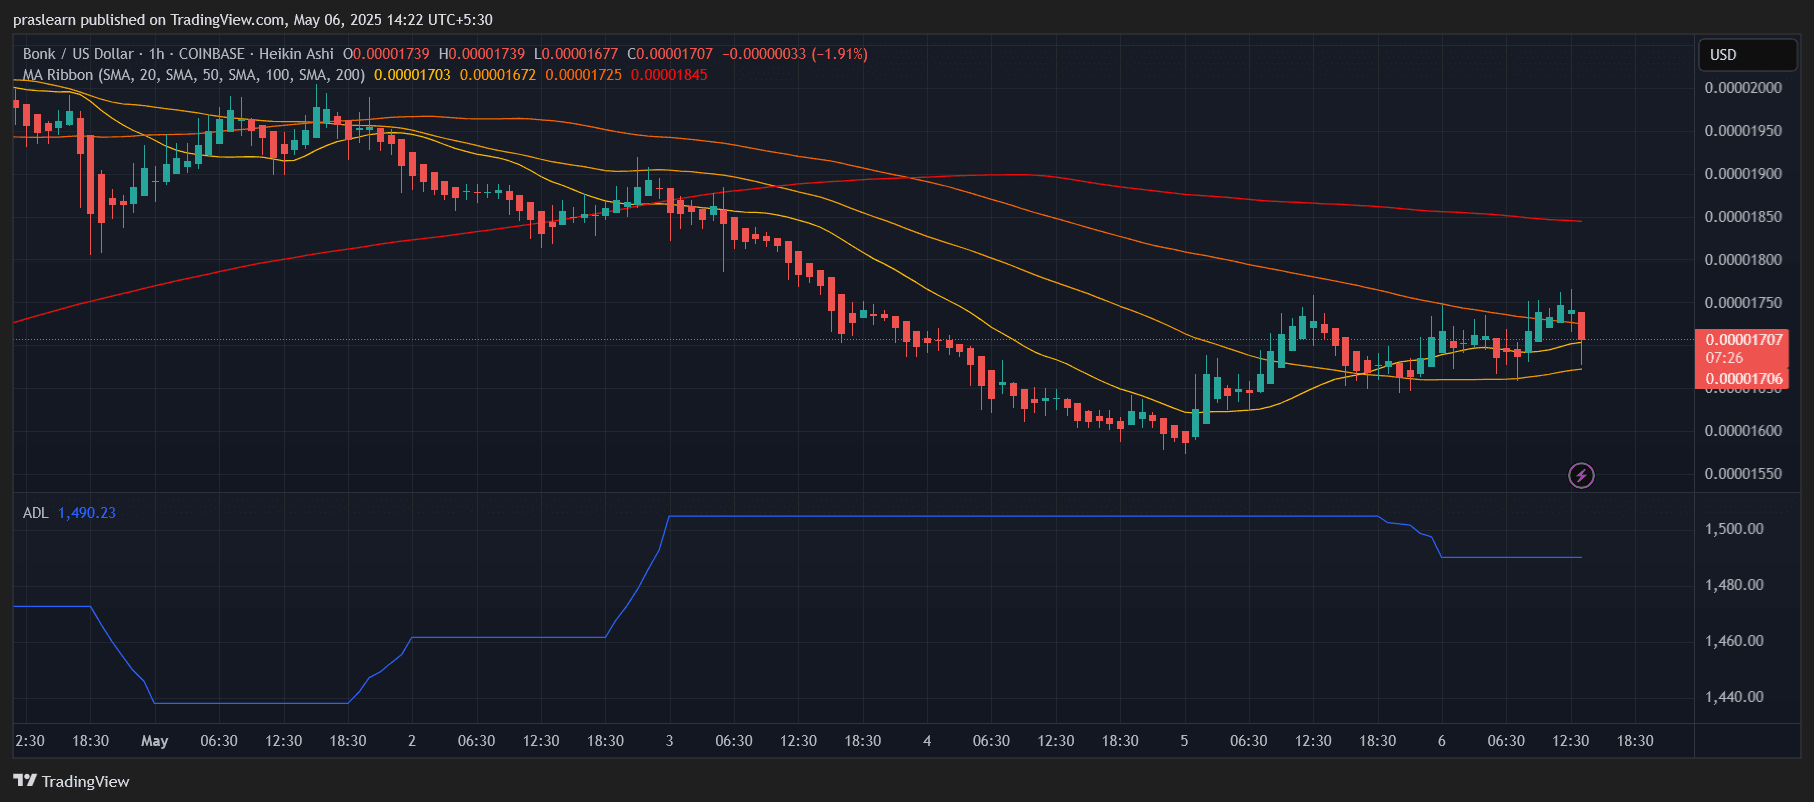
On the hourly chart, $BONK coin recently faced rejection at around $0.00001739 after trying to break above local resistance. The MA ribbon shows a bearish alignment as the price slipped back below the 100-hour SMA ($0.00001725) and is now hovering just above the 50-hour SMA.
What’s encouraging is that despite short-term volatility, $BONK has formed a base above $0.00001650 multiple times—creating a reliable support zone. The price action has also shown multiple bullish engulfing candles near the $0.00001660–$0.00001680 area, indicating buyers are absorbing the dips.
Still, caution is warranted. A drop below $0.00001650 could lead to a short-term retracement toward $0.00001550 or even $0.00001500. But if $BONK can reclaim the $0.00001750 level convincingly, the hourly trend could flip bullish, setting the stage for retesting $0.00001800–$0.00001850 soon.
Can $BONK Price Rally Sustain Into Late May 2025?
If the broader crypto market remains stable and $BONK price maintains its current trend above the 50-day SMA on the daily timeframe, there’s a strong chance it could revisit the $0.00002000–$0.00002300 zone in May. However, this rally is contingent on a breakout above the descending resistance line and consistent volume backing the move.
$BONK’s popularity, meme coin appeal, and ecosystem activity on Solana can catalyze another rally. But without strong momentum or a clear breakout above current resistance levels, the coin might remain rangebound between $0.00001600–$0.00001800 for the next few days.
Will $BONK Coin Fly or Stall Out?
From a technical standpoint, $BONK coin shows promise on the daily chart with bullish crossover signals and improving ADL strength. Short-term resistance still poses a challenge, and the hourly chart reveals indecisiveness. A clear break above $0.00001850 would be the key signal to watch for a trend continuation toward $0.00002000+. Until then, traders should stay cautious, but hopeful, as $BONK edges closer to another breakout moment.