- The Terra price analysis is bearish today.
- Resistance for LUNA is present at $69.
- Support for LUNA/USD is present at $59.9.
Terra price analysis is bearish, indicating a decline in price today. As seen in the graph below, a bearish trendline is drawn to represent resistance for the bulls. To continue with an upward movement, LUNA needs to break above it. A support level of $59.9 is present but will not be enough if we wish for a bullish continuation.
On the daily chart, you can also see that we are in a long-term downtrend with resistance overhead at $76.4. If this trend continues until the end of the day, expect resistance to be strong and bulls to struggle to break above it.
Terra price movement in the last 24 hours: Bearish sentiment
LUNA/USD is stable, with a price that has not changed much over the past day. However, there are some signs of bull pressure, as seen in the graph below. A breakout above will most likely send LUNA/USD to $69.
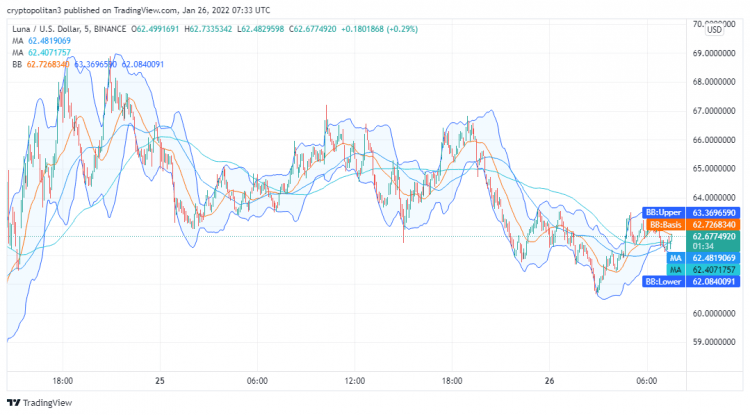
The volatility is still high as the Bollinger bands are still expanded, so there is still room for movement in either direction. The MACD indicator shows the presence of bearish momentum, but it does not have enough strength yet to send the price towards a bullish or bearish trend.
Luna 4-hour price chart: Bollinger bands expanded?
The bollingerInes indicator shows a high level of volatility, with the price bouncing back and forth between the two levels. The upper band is still expanding, indicating no strong pressure from either bulls or bears. If the rate of change remains negative, we will see a downward movement in price towards $59.9. A breakout above $69 will result in a bullish continuation towards the resistance at $76.4.
The Ballance orf power indicator does not show much movement for Luna over the past day, but it is becoming more apparent that bulls have been trying to break up from their long-term bearish trendline. If this trend continues over the next few days, we can expect Luna to continue its bullish movement towards $69.
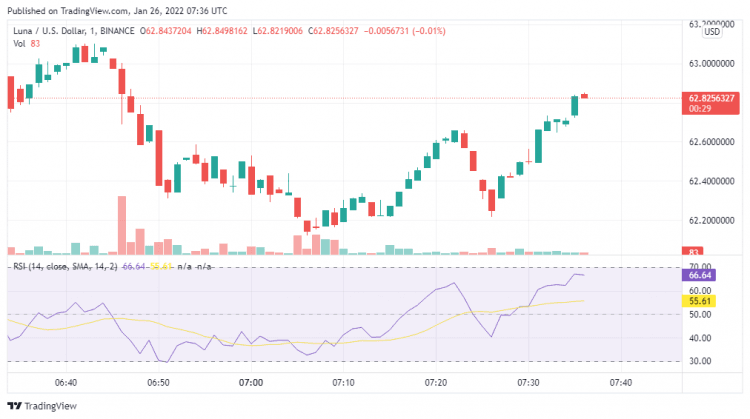
LUNA/USD is trending downward, and we will need to break above resistance for a bullish continuation. Support is at $59.9, but you recommend that you wait until we break and hold above the chart’s resistance before investing. You can see that the MACD is in bearish territory, where it’s trending downward.
The RSI is at 66 and seems to be ending to the overbought region. This is an indication that buyers are increasing in the market. They’re usually a good bet, but they tend to be wrong a little too much for my taste recently. What’s worse is that if you choose to follow them, you will likely enter an investment after the price has already started dropping. This means having to wait longer before your investment begins paying off and gives you less time for an upward trend before the downtrend drops the price again.
Terra Price Analysis: Conclusion
Terra price analysis concludes that Luna is not strong enough to break through resistance. However, it will be supported by the bearish trendline. A breakout of this support level or a bullish crossover of the MACD indicator might have us see Luna at $69 again soon.
Disclaimer. The information provided is not trading advice. Cryptopolitan.com holds no liability for any investments made based on the information provided on this page. We strongly recommend independent research and/or consultation with a qualified professional before making any investment decisions.