Stellar ($XLM) has been relatively quiet after its strong performance at the end of 2024, and traders are wondering whether this calm is the calm before a bullish storm—or just a prolonged consolidation. Currently priced at $0.268, $XLM is hovering below key moving averages, leading many to ask: Can $XLM price really surge to $2 in the next 15 days? Let’s dive into the daily chart to break down the possibilities.
Stellar Price Prediction: Is $XLM Gearing Up for a Breakout or Breakdown?
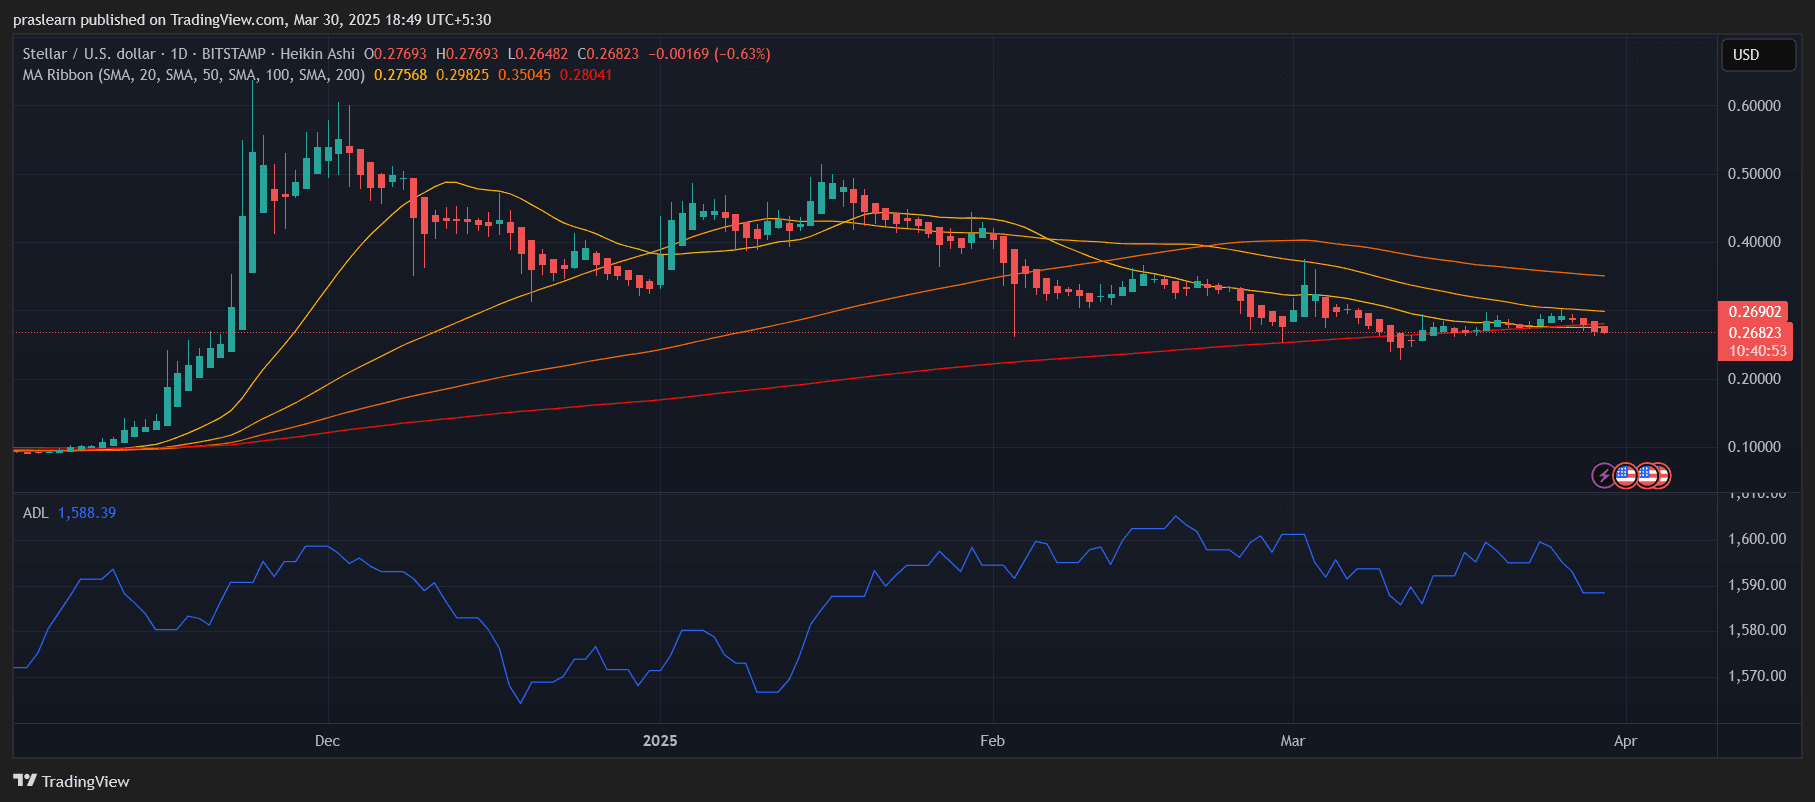
The chart shows Stellar forming a gradual downtrend after its euphoric rally in December 2024, where it briefly peaked near $0.60. Since then, the momentum has slowed considerably. The recent candles are Heikin Ashi, which helps smooth out price action and clearly highlights prevailing trends. Right now, we’re seeing mostly small-bodied candles—signs of market indecision and low volatility.
One critical observation is the compression of price action below the 20-day, 50-day, and 100-day simple moving averages (SMA). The 200-day SMA lies below the current price, acting as a longer-term support at ~$0.28, which $XLM price is now dancing around. This suggests a battle between short-term bearishness and long-term structural support. However, the inability to break above even the 20-SMA at ~$0.275 highlights the current weakness in buyer momentum.
What Do the Indicators Say?
The chart includes two critical technical tools:
- MA Ribbon (20, 50, 100, 200 SMA): The moving average ribbon is clearly bearishly stacked—with shorter-term SMAs below longer-term ones, confirming a bearish phase. The price is currently stuck below all key short-term MAs, meaning there’s significant overhead resistance. A bullish breakout would require $XLM to first reclaim $0.28, then break above $0.30–$0.35 to reestablish a bullish trajectory.
- Accumulation/Distribution Line (ADL): The ADL currently stands at 1588.39 and shows slight downward slope—indicating that distribution (selling pressure) still dominates over accumulation.There hasn't been a strong surge in volume that would typically precede a bullish breakout, suggesting smart money hasn’t stepped in yet.
Together, these indicators paint a picture of a range-bound asset in a waiting phase, where bulls and bears are in equilibrium—but that could change fast with a news catalyst or Bitcoin-led rally.
Is $2 Realistic in 15 Days?
Let’s be clear: a move from $0.268 to $2 would represent a 645% rally in just two weeks—an extreme and unlikely outcome unless a massive fundamental catalyst occurs, such as:
- A major Stellar adoption announcement
- Integration into a global payments platform
- A broader altcoin season supercycle led by Bitcoin's parabolic rally
Historically, Stellar is capable of sharp vertical moves during speculative bull runs, but we’re not currently in that environment. For $XLM price to break $2, it would need to shatter through multiple resistance layers, including $0.30, $0.40, $0.60, $1.00, and $1.50, in rapid succession—all without being rejected. That’s a tall order with current indicators showing low volume, bearish MA alignment, and weak accumulation.
What Price Levels Should You Watch?
If you’re trading or investing in $XLM, keep your eyes on the following levels:
- Support: $0.26 (critical short-term support), $0.24 (January low), $0.20 (psychological base)
- Resistance: $0.275 (20-SMA), $0.30 (major resistance), $0.35 (trend reversal confirmation)
A bullish scenario would involve a clean break above $0.30 with volume confirmation, followed by retesting it as support. A bearish scenario would see $XLM lose $0.26 and fall back toward $0.24 or lower.
Stellar Price Prediction: Moonshot or Mirage?
While the crypto market is known for its unpredictability, the technicals don’t support a $2 price target within 15 days for Stellar—at least not without an unexpected explosive trigger. The trend is currently sideways-to-bearish, with multiple moving average resistances capping upside momentum and no strong signs of smart money accumulation.
However, if broader market sentiment improves and $XLM price manages to break above $0.35 with volume, a short-term rally toward $0.50–$0.60 is within reach. Until then, traders should stay cautious and watch for breakout signals before betting on a moonshot.