- Coin value is now touching $191.7 mark.
- Kusama price analysis shows uptrend.
- New support to be found below $196.63.
The recent Kusama price analysis shows that the market provides an edge to the bulls by raising the price to $191.67. This is a positive sign for the buyers, as the price remained under the bearish shadow in the previous weeks. But now, the bulls are struggling to attain their leading position back, and a slight improvement in cryptocurrency’s value has been observed over the past 24-hours.
KSM/USD 1-day price chart: Bullish impulse saves price from further downfall
The one-day Kusama price analysis confirms an upward trend for the market as the bulls have successfully managed to escape bearish pressure. The bears dominated the price chart over the past two weeks as the downtrend reached its peak. But now, the chances of survival are increasing for KSM, as the price has moved up to $191.7. The moving average (MA) value is still at a much greater position, i.e., $239.89.
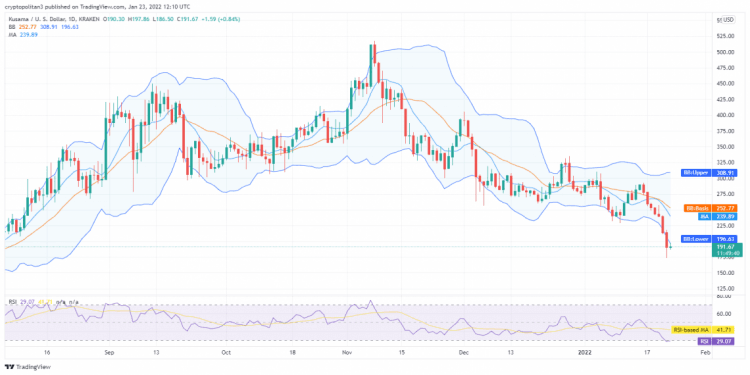
On the contrary, the volatility is increasing, which is not a positive indication regarding the upcoming price trends. The upper edge of the Bollinger Bands Indicator is now at $308.91, whereas its lower edge is present at $196.63. The Relative Strength Index (RSI) score has gone below the under-bought limit, i.e., 29.07.
Kusama price analysis: Price takes a downturn to $191.67 after recent clash
The bears have retained their upper hand for the past few hours, following a downside. After the recent trend reversal, the price has decreased considerably and has slumped down to $191.67 low. This is a quite discouraging sign for the buyers as they have been defeated in the recent hours. Moreover, the moving average (MA) value for the four-hour price chart stands at $189.18.
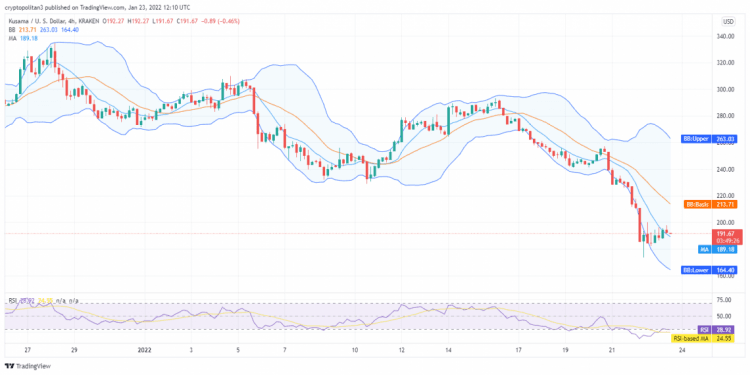
The SMA 50 curve is also much taller than the SMA 20 curve as the bears have constantly been reigning the price chart. Furthermore, the upper Bollinger band is now present at $263.03 extreme, whereas the lower Bollinger band is at $164.40 end. The RSI score is also quite low, i.e.28.92, due to the continuous declining trend.
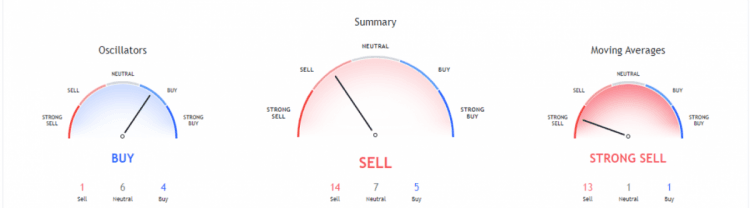
A constant bearish trend has been following the market as the price touched many low points throughout the past few weeks. Today’s trend has been no different, and the technical indicators chart is going bearish. There are 14 indicators present on the selling end; seven are on the neutral end, while only five are on the buying end.
The Moving Averages Indicator is giving out a strong selling signal because of the bearish wave. Thirteen indicators are on the selling position while one is standing on the neutral and buying positions. On the other hand, the Oscillators are predicting an uptrend as four indicators are on buying position, six indicators are on neutral. In contrast, only one indicator is on the selling position.
Kusama price analysis conclusion
As confirmed from the above 1-day and 4-hours Kusama price analysis, the price has shown signs of a slight recovery in the last 24-hours. The bears have been ruling the market for the past month, but today, an upward movement is being recorded. The coin value is now $191.67, and further improvement can only follow if the bulls receive massive support. Similarly, the hourly price prediction signals a drop as the bears cause the price to level down.
Disclaimer. The information provided is not trading advice. Cryptopolitan.com holds no liability for any investments made based on the information provided on this page. We strongly recommend independent research and/or consultation with a qualified professional before making any investment decisions.