- Price has recovered up to $16.36.
- Bullish trend is likely to pursue
- Support has been shifted below $16.66.
The recent Chainlink price analysis displays encouraging results for the bulls today, as the trends have undergone a slight shift. Although a massive drop in the coin value was recorded in the prior weeks, today’s trend seems relatively promising. After a massive fall, the price has received an uplift and has climbed above $16.36. Further improvement in coin value is expected if the bulls remain persistent.
LINK/USD 1-day price chart: Bulls manage to discontinue chances of further drop
The one-day Chainlink price analysis supports the buyers today, as chances of recovery are rising for the bulls. After a period of constant decline, the bulls are on their way to uplift price to its former heights. The bullish momentum is likely to intensify in the upcoming week, and the price might jump past its current level, i.e., $16.36. The moving average (MA) value is at a much greater height and is present at $20.99.
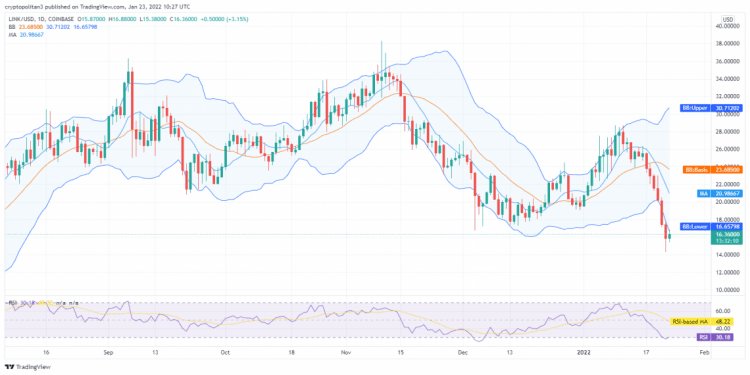
The volatility is increasing as the area between Bollinger bands is expanding, a bearish sign. The upper value of the Bollinger Bands Indicator is now standing at $30.71, whereas the lower value has dropped down to $16.67. The Relative Strength Index (RSI) score is critically near the under-bought threshold, i.e., 30.18.
Chainlink price analysis: Recent developments and further technical indications
The four-hour Chainlink price analysis shows a rising trend as the bulls have been leading the market for the past few hours. The upward trend seems to be expanding as a rise in price has been detected in the last four hours. The buyers have successfully led the price above $16.3 after constant strikes. The recent upsurge has driven the price above its moving average value, i.e., $15.903.
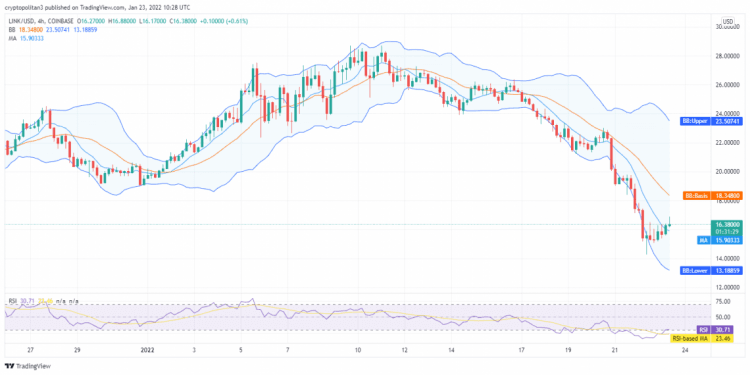
The short-term trending line is moving ascendingly, which further confirms an upcoming upside. Meanwhile, the upper hand of the Bollinger Bands Indicator is now present at the $23.51 marker, whereas its lower hand is present at $13.2. The RSI score is still quite low as the bears dominated earlier, and the curve is touching the 30.71 level.
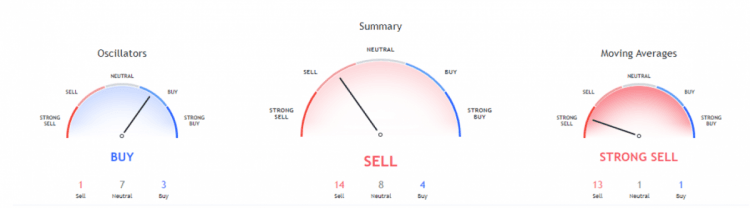
The past few months have proved to be exceedingly detrimental to the overall market value of LINK/USD. The technical indicators chart thus gives out a bearish signal as more selling activity has been observed. There are 14 indicators on the selling mark, eight on the neutral, and four on the buying mark.
The Moving Averages Indicator is showing strong support for the sellers. 13 indicators are present on the selling side. In contrast, one indicator is found on the neutral and buying positions. On the other hand, the Oscillators are going bullish as seven oscillators are on the neutral level, three indicators are on the buying level, and only one indicator is on the selling level.
Chainlink price analysis conclusion
The 1-day and 4-hours Chainlink price analysis favors the buyers, as an increasing trend is being recorded for the day. Although the circumstances remained quite unfavorable for the cryptocurrency in the last few weeks, today has proved to be encouraging. The price is now settling at the $16.36 mark, and the hourly price prediction also predicts similar trends. The bulls are striving hard to win back their position.
Disclaimer. The information provided is not trading advice. Cryptopolitan.com holds no liability for any investments made based on the information provided on this page. We strongly recommend independent research and/or consultation with a qualified professional before making any investment decisions.