- Chainlink price increased 7 percent over the past 24 hours
- LINK has been in continuous decline since falling from $26.76 last week
- Price looks set to provide buying opportunity at support
Chainlink price analysis for the day suggests price is in line for an increment towards the $30 mark after finding an upturn over the day’s trade. LINK declined 7 percent to move as low as $19.84 over 24 hours, with the crucial 25 and 50-day exponential moving average (EMA) far from sight at $23.79. After falling successively since the start of the year from $28.72, Chainlink dropped almost 40 percent to current level. The token has formed a local bottom at $21.24 with support at $20. The token provides a buying opportunity below current support and could test the $30 resistance if buyers can consolidate momentum, with some sell offs also expected around the $28.24 region.
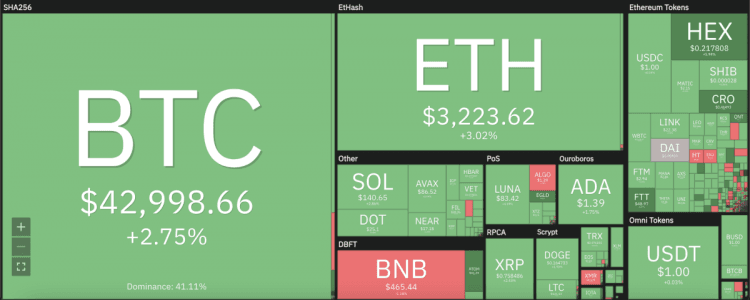
The larger cryptocurrency market showed positive returns during the day’s trade, with Bitcoin increasing 3 percent up to $43,000. Ethereum rose 3 percent up to $3,200, whereas Altcoins also showed positive movements across the market. Cardano rose 2 percent to $1.39, Ripple 3 percent to $0.75, Dogecoin 2.5 percent to $0.16 and Solana 3 percent to $140.76. Terra continued its impressive rise, moving 4 percent north to sit at $83.45.
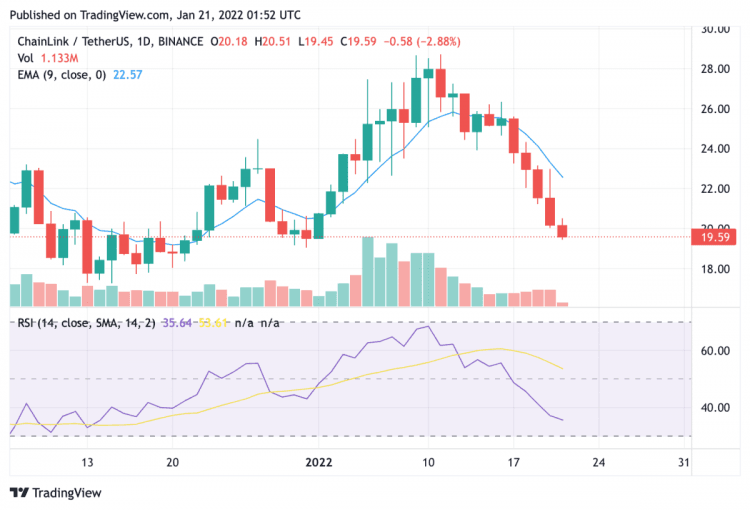
LINK/USD 24-hour chart: Price struggles to find upward momentum
On the 24-hour candlestick chart for Chainlink price analysis, price can be seen receding below the $20 support zone to continue its decline set since the new year. The 25 and 50-day moving averages sit far away from current price at $22.57 with no potential buying momentum in place. The relative strength index (RSI) shows meagre market valuation for LINK at 35.49, with further potential to drop. Trading volume also dipped more than 25 percent over the past 24 hours. Chainlink remains in downtrend but provides an excellent buying opportunity at current trend below support, and buyers are expected to push price back above $20 to face first profit taking scenario around $25.72.
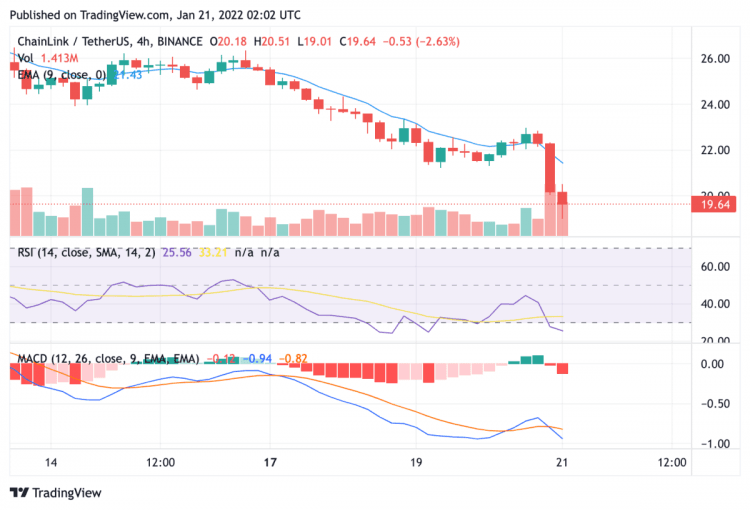
LINK/USD 4-hour chart: Low RSI suggests no upturn in sight
The 4-hour chart for the LINK/USD trade pair in Chainlink price analysis also presents a bleak sight, with price declining heavily over the day’s trading sessions. LINK is set to ship further downwards, as suggested by short term technical indicators. The RSI value represents very low market valuation at a receding value of 24.71. The moving average convergence divergence (MACD) has also formed bearish lows as it dipped below the neutral zone on January 20. Over the last trading sessions, buyers can be seen attempting to push price back above support, only to be rejected by selling momentum. The current trend provides a buying opportunity for LINK but the market remains skeptical at present point.