- The Chainlink price analysis is bearish today.
- Support for LINK/USD is present at $21.8.
- The resistance for LINK is present at $23.
The Chainlink price analysis is bearish today, as the LINK after rejection at $25.5 on Monday 17th January continues to slip down, and the price has sunk to the $22 range today. Selling pressure is quite high as the RSI is also headed straight down. As the cryptocurrency covers range downwards, the next support for LINK is present at the $21.8 level. Overall the LINK went through a great loss during the past week as the trend remained bearish and the coin’s price suffered severely.
LINK/USD 1-day price chart: bulls to hold on to $21.8
The 24-hour Chainlink price analysis shows the price has reduced from $23 to $22.2, as the LINK/USD pair is trading hands at the later value at the time of writing. Due to the continuous downtrend, LINK reports a loss in value by 2.10 percent over the past 24 hours and a loss of more than 16 percent over the past week. The market cap also suffered by 1.08 percent, but the trading volume increased by 6.35 percent, providing a market dominance of 0.52 percent to the LINK.
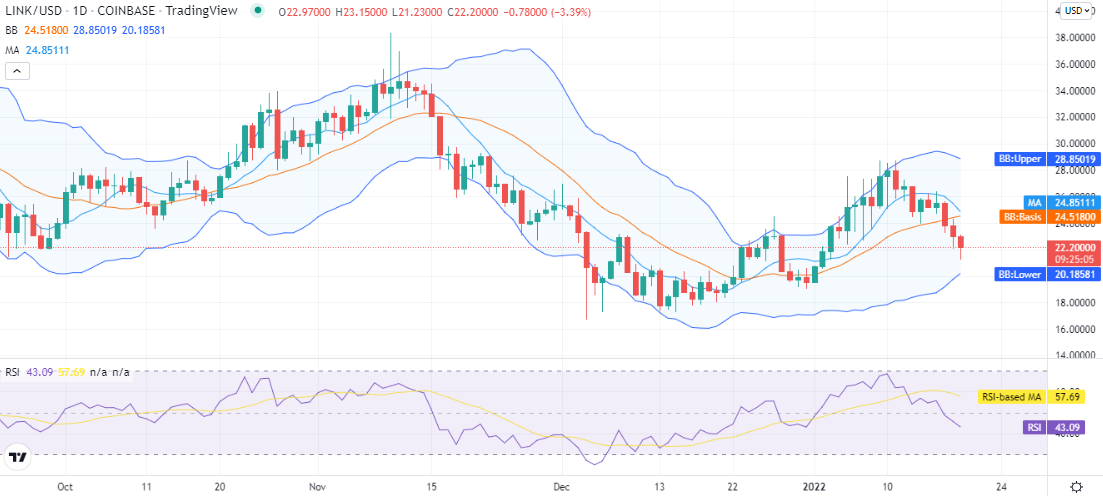
The volatility is high for LINK/USD as the Bollinger bands are covering more area with the upper band at the $28.8 mark, representing resistance for LINK, and the lower band at $20 representing support for the falling price, the average of the indicator is present at $24.5.
The relative strength index (RSI) has fallen sharply and is on a steep downwards slope at index 43. The indicator hints at the strong selling activity in the market. However, the RSI is still in the neutral range but hints at the current bearish situation.
Chainlink price analysis: Recent developments and further technical indications
The 4-hour Chainlink price analysis shows that the LINK price has been falling consistently today, and the first eight hours observed the major part of the decline. However, the support has been seen in the preceding hours, and the bulls have elevated the price back to $22.2 level in the last few hours, after swinging low towards $21.5.
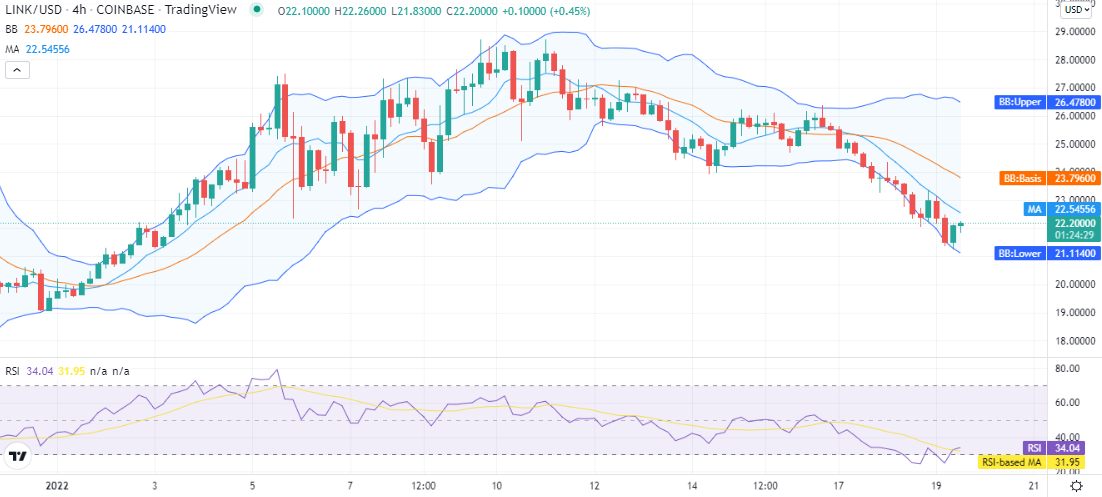
The volatility is also high on the 4-hour chart, and further increases as the Bollinger bands are expanding, with the upper band at the $26.4 mark and the lower band at the $21.1 mark. The price has been recovered to trade above the lower limit of the volatility indicator as it was seen stepping below this level previously today. The RSI is again taking a horizontal turn after recovering from the underbought zone to index 34, which shows the support factor coming into play, but the horizontal curve is also hinting at selling pressure appearing again.
Chainlink price analysis: Conclusion
The Chainlink price analysis suggests the LINK/USD price has lowered further today as a continuation of the bearish slide. The technical indicators also suggest bearish domination, but for intraday traders, the price has come down, but a slight recovery has also been made. However, the RSI curve hints that the selling pressure may return again, and the coin may continue further downside.
Disclaimer. The information provided is not trading advice. Cryptopolitan.com holds no liability for any investments made based on the information provided on this page. We strongly recommend independent research and/or consultation with a qualified professional before making any investment decisions.