- Shiba Inu price recovered above the weekly support level at $0.0000283, signaling a bullish regime.
- The triple bottom setup seems to be playing out, indicating a 35% uptrend is likely.
- A four-hour candlestick close below $0.0000273 will invalidate the bullish thesis.
Shiba Inu price has been on a slow downtrend for the last few months. However, things seem to be turning around as SHIB sets a base, indicating that the downtrend is over.
Shiba Inu price to collect liquidity
Shiba Inu price set two swing lows at $0.0000287 on December 4 and December 20, 2021. Unlike the usual triple bottom setup, the third tap on this support level failed to hold and create a swing low at $0.0000254.
This technical formation is a bottom reversal pattern and signals the start of an uptrend. Going forward, investors can expect SHIB to see a surge in bullish momentum that propels it to $0.0000327 after a 12% ascent.
Clearing this hurdle will open the path for a retest of $0.0000392, bringing the total run-up to 35%. Interestingly, this level is a weekly resistance barrier and where SHIB set equal highs in late 2021.
Therefore, market makers will likely push SHIB to sweep this hurdle and collect the buy-stop liquidity resting above it.
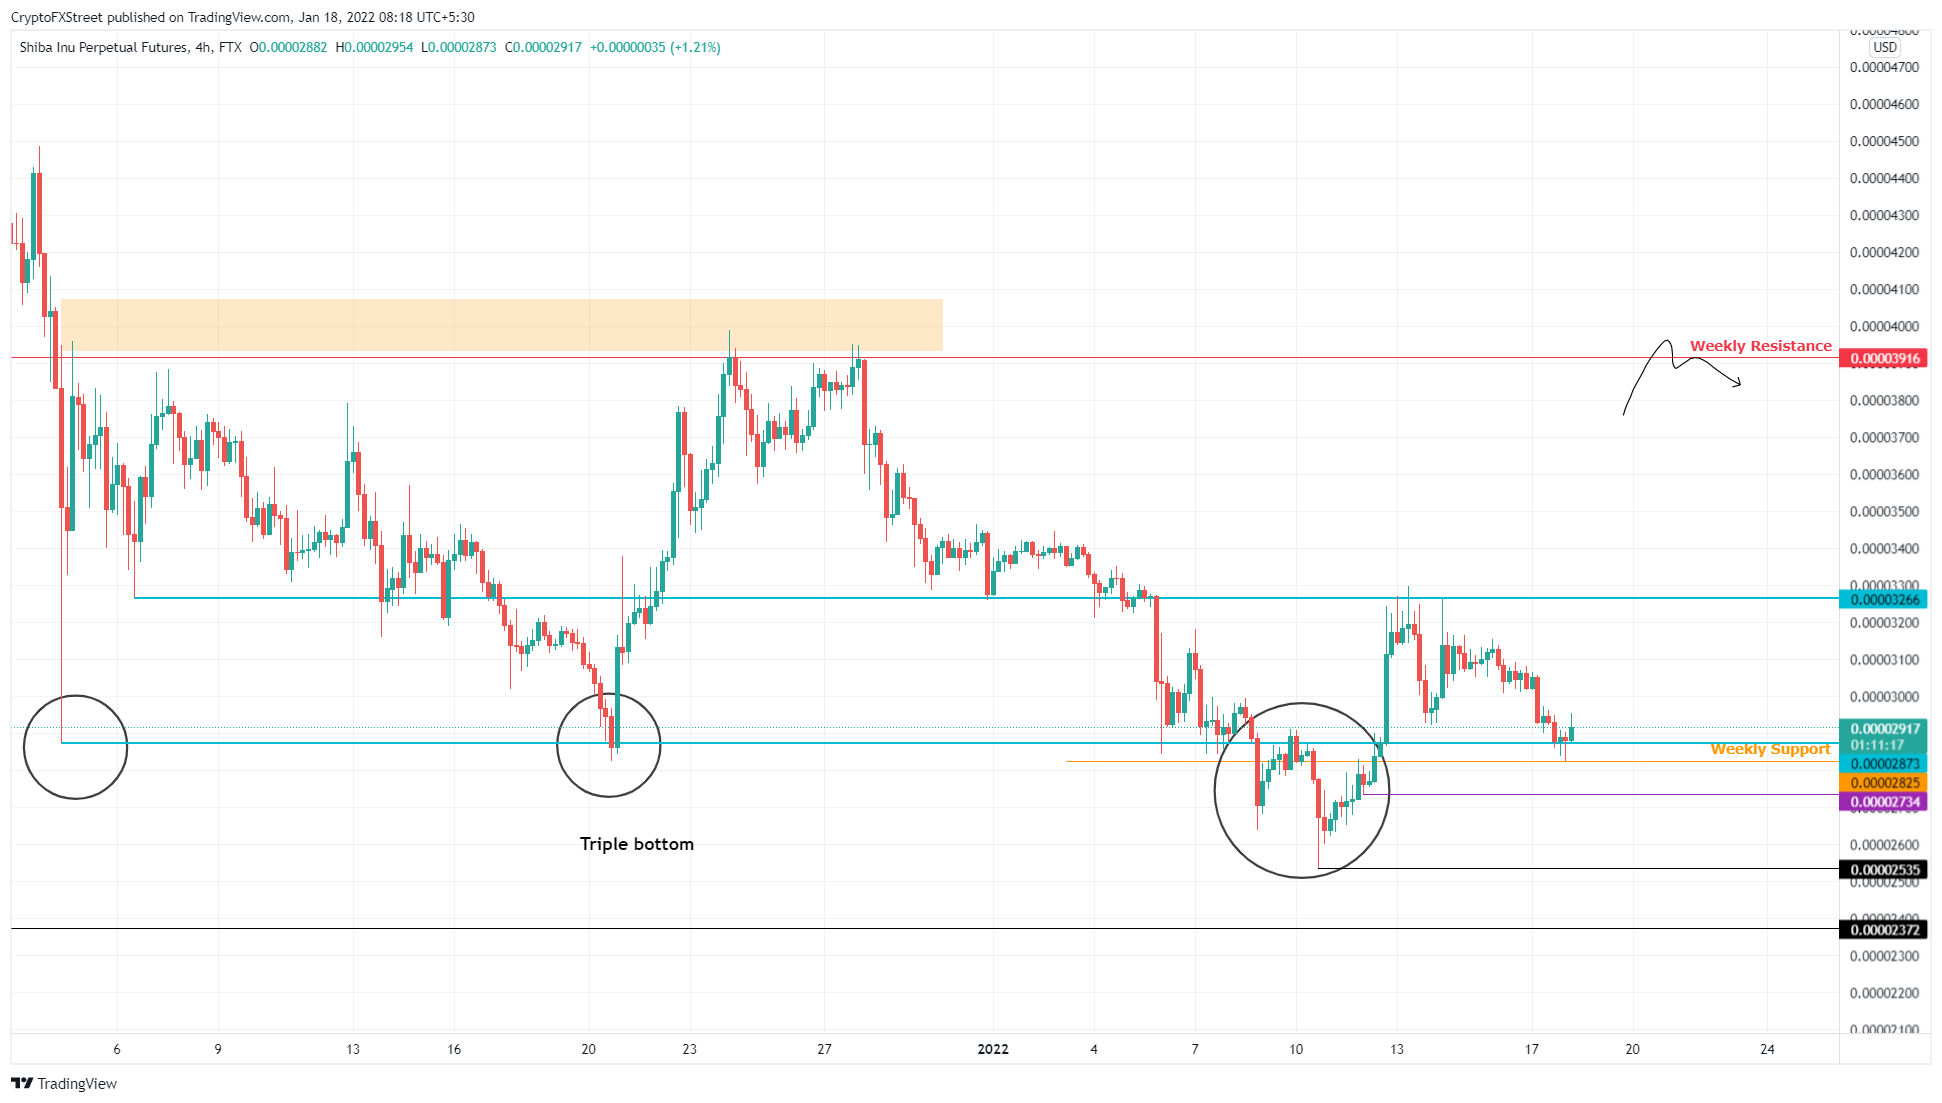
SHIB/USDT 4-hour chart
On the other hand, if Shiba Inu price fails to hold above the weekly support level at $0.0000283, it will indicate a weak bullish camp. This development could further knock SHIB down to $0.0000273.
If the meme coin produces a four-hour candlestick close below this hurdle, it will create a lower low, skewing the favor in bears’ favor and invalidating the bullish thesis.
In such a case, Shiba Inu price could revisit the $0.0000254 swing low and attempt another comeback.