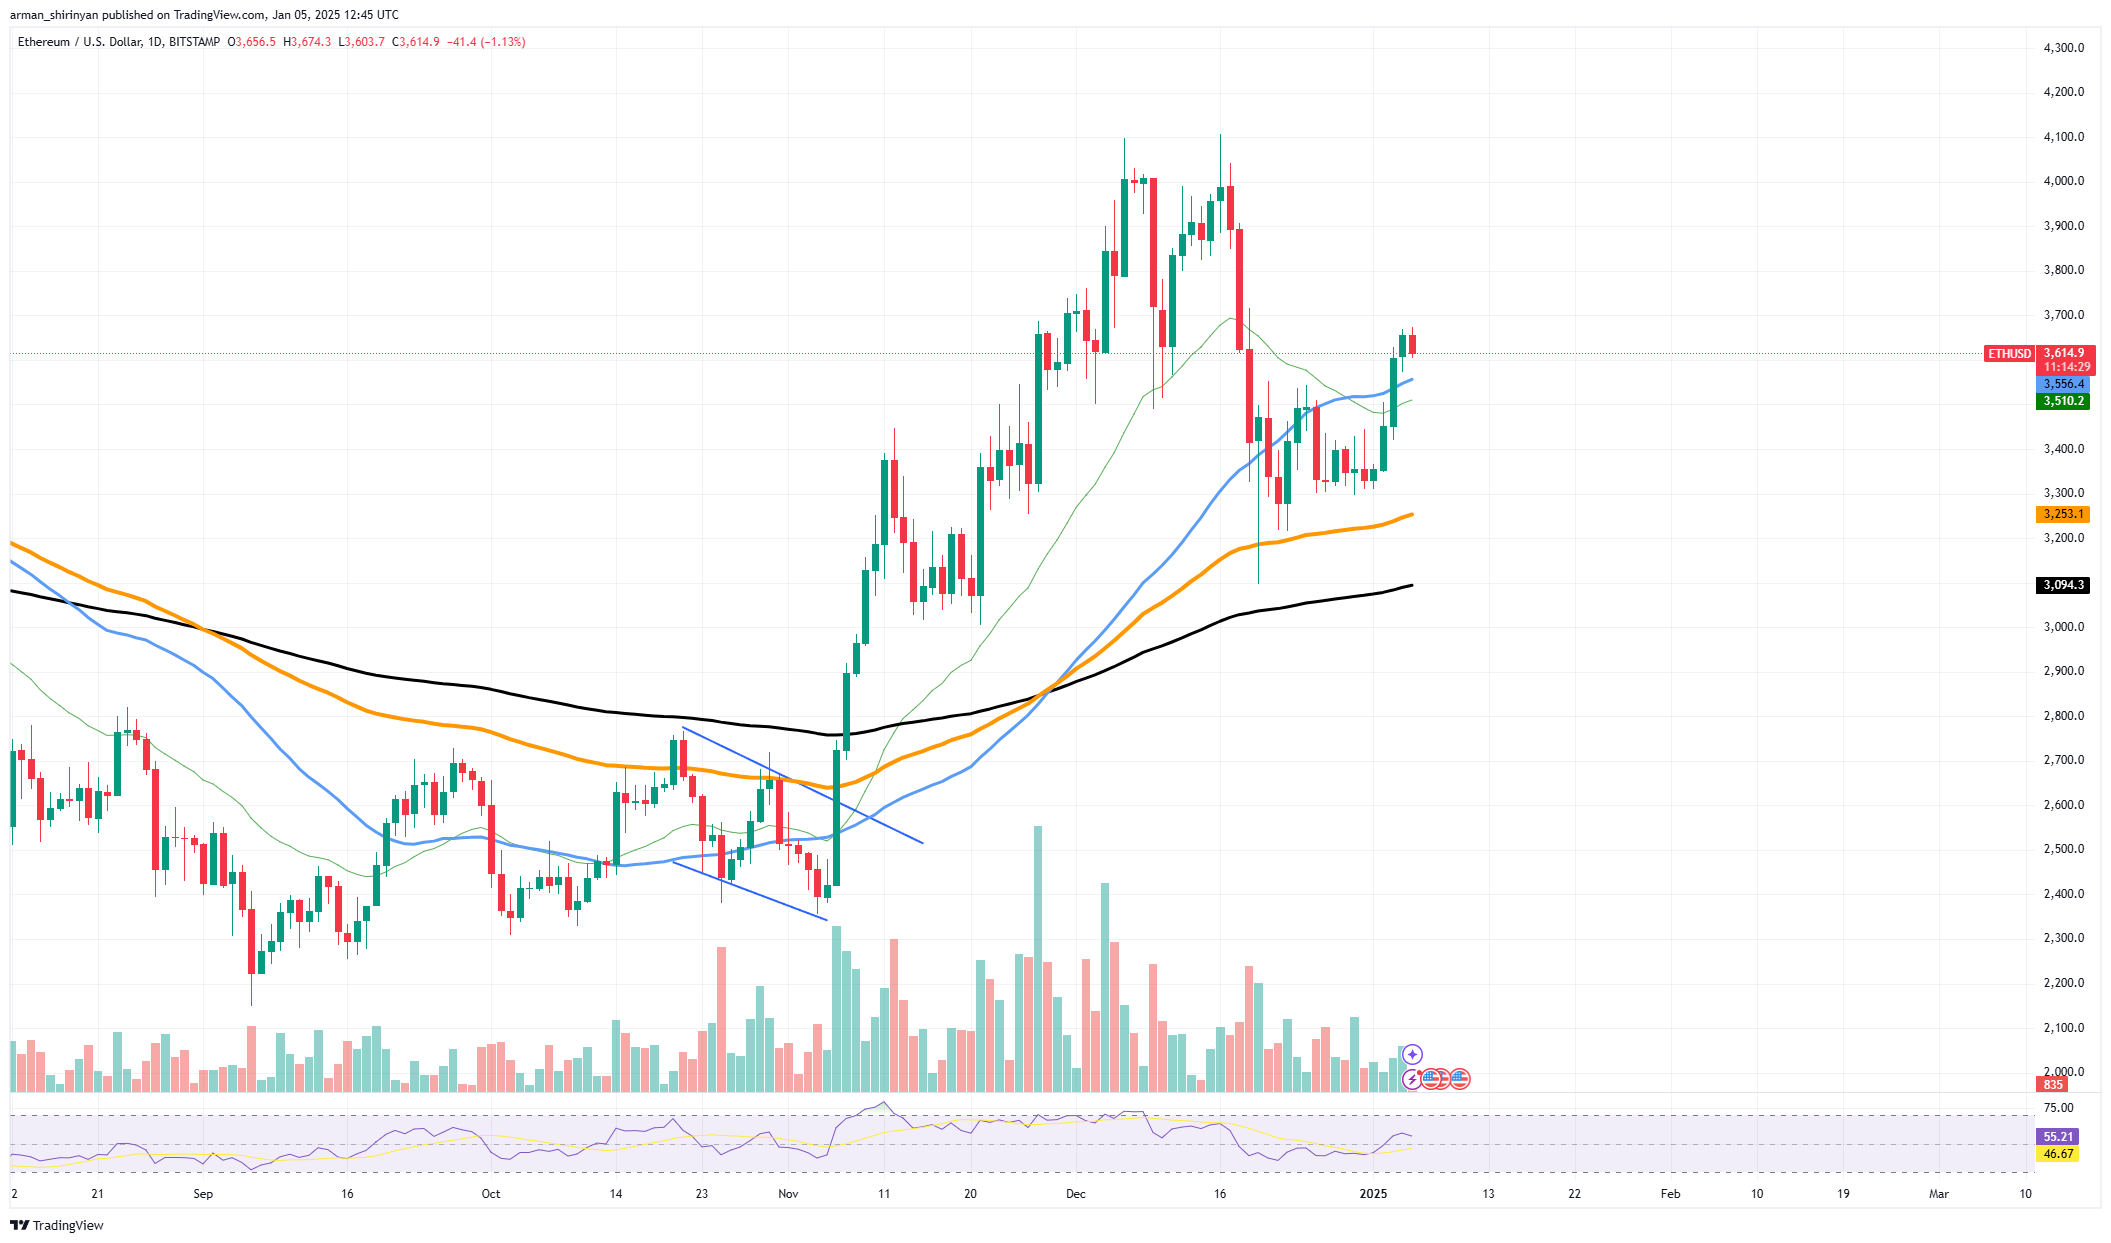
As the second-largest cryptocurrency continues to attract investor interest, Ethereum has solidified a noteworthy price breakthrough, indicating bullish momentum. Ethereum is currently trading at about $3,615 after surpassing significant resistance levels and continuing on its upward trajectory.
An increase in investor confidence has been brought about by the recent move above the $3,500 mark, which corresponds to the 50-day exponential moving average (EMA). Ethereum has used this level as a major resistance in recent months, and its breach indicates that bullish sentiment is becoming stronger. Investors should keep an eye on the $3,700 level as the next resistance level, while the $3,500 level now serves as crucial support.

The 200-day EMA is a reliable gauge of long-term bullish momentum, and Ethereum has held its position above it on the technical side. Currently the Relative Strength Index (RSI) is at about 55, indicating that upward movement is still possible without going into overbought territory. The breakout of Ethereum is not happening alone.
There has been a surge in activity on the larger cryptocurrency market, with altcoins doing well and Bitcoin stabilizing above $96,000. Ethereum might get the support it needs from this market-wide momentum to soon aim for the $3,800 region. Nonetheless, there are still concerns about trading volume.
Even though the price movement of ETH is clearly bullish, the absence of a notable increase in trading volume raises the possibility that the breakout will not have the broad participation that is usually seen during long-term rallies. Investors should keep a careful eye on volume to determine how strong this movement is.
It will be crucial for Ethereum to hold above $3,500 and keep up its current momentum in the upcoming weeks. The path to $4,000 looks more likely if the asset can consolidate above this level and draw in more trading volume. On the downside, ETH might retest the $3,300 support level if it is unable to hold $3,500.
SHIB's retrace
After a brief surge in value, Shiba Inu has retreated. The 26-day exponential moving average (EMA), a crucial resistance level, was first broken by the asset, but it has since fallen back to lower levels. With a current price of about $0.00002379, SHIB's recent performance demonstrates continued difficulties in sustaining bullish activity.
For SHIB, the absence of substantial trading volume is one of the main issues. Almost no volume has been seen since the initial breakout, indicating that investors are not very interested in buying. Due to this lack of involvement, SHIB has been unable to establish a more stable upward trend and is now susceptible to retracements. Additionally, technical indicators present a troubling image.
The fact that the Relative Strength Index (RSI) is now below 50 suggests that bearish momentum is in control. Given the downward trending RSI and the lack of a notable uptick in trading activity, it appears doubtful that SHIB will regain its footing anytime soon. The $0.00002254 level serves as a crucial support for the time being.
It is possible to anticipate additional declines toward $0.00002100 if SHIB is unable to maintain above this level. The next significant resistance level is $0.00002552, which bulls would need to push above in order to regain momentum and inspire investor confidence. In the future, the low trading volume will continue to be a major barrier.
Solana's potential
Solana, which is presently trading at $219, appears to have reached a crucial resistance level as it tries to break above the 50-day exponential moving average. The asset's inability to overcome this level, which has proven to be a formidable obstacle, begs the question of whether its recent upward momentum can be sustained.
Traders frequently use the 50 EMA as a key indicator to determine an asset's medium-term trend. A rejection indicates ongoing bearish pressure, while a break above it usually indicates a change in sentiment toward a bullish outlook. In Solana's instance, the 50 EMA is serving as a ceiling, halting additional price increases and making it susceptible to corrections. At present, Solana is trading at about $213 just below this resistance.
The $240-$250 range, which would draw fresh buying interest, could be the target of Solana's push if the 50 and 26 EMA levels are both successfully crossed. But if these important EMAs are not broken, there may be a retracement to the $200 support level, and if bearish pressure increases, there may be additional declines toward $196.
It is crucial to fight around the 50 EMA for the time being. A surge in activity may give traders and investors the momentum they need for a breakthrough, so they should keep a careful eye on volume. Until then, Solana is still at a turning point, and its immediate future is uncertain.
 u.today