A prominent crypto analyst, Cobra Vanguard, has highlighted a bullish structure forming on Dogecoin’s weekly chart.
His recent analysis suggests the meme coin could be gearing up for a rally toward the $1 mark, a psychological level DOGE has been eyeing for years. The latest analysis comes on the back of Dogecoin’s recent uptrend, which saw it rise to $0.44 before facing a pullback.
Dogecoin’s Rounded Bottom and AB=CD Pattern
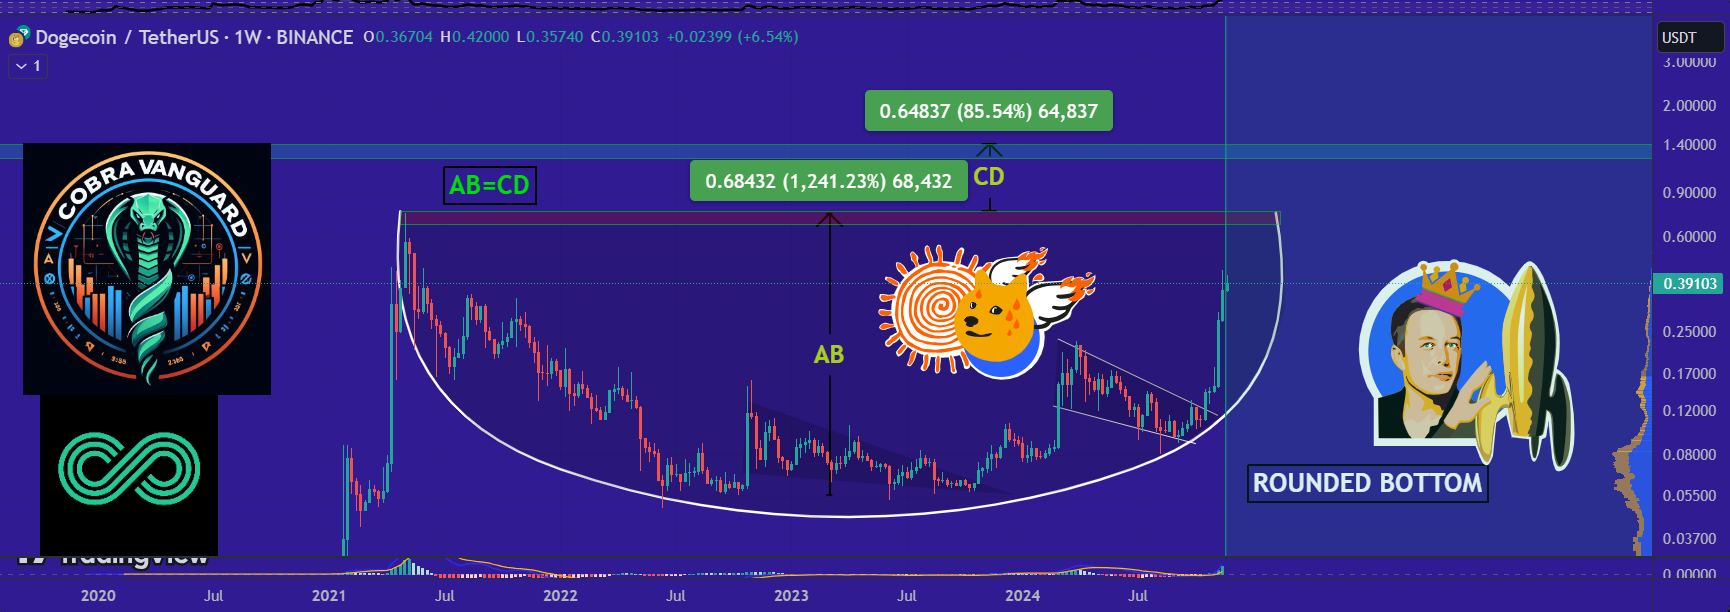
Cobra Vanguard shared a weekly chart revealing a rounded bottom pattern that has developed for Dogecoin since early 2021. This is a bullish structure that often indicates an upcoming price breakout following an extended consolidation.
For the uninitiated, a rounded bottom indicates growing market accumulation, where bearish momentum tapers off, setting the stage for a bullish resurgence. In Cobra Vanguard’s chart, the Dogecoin price has recently broken out of the rounded base at $0.35 and is currently at $0.39.

The analyst predicts an AB=CD harmonic pattern, where the price could rally toward $0.68. This represents a 1,241% Fibonacci projection from the base of the pattern. Moreover, Fibonacci extensions suggest further resistance zones at $0.65 (85.54% measured from the breakout) and ultimately $1.
Interestingly, the volume confirms this bullish outlook. Increasing buy-side activity accompanies the breakout, confirming strong momentum. If sustained, the pattern completion could send Dogecoin into uncharted territory, mirroring its meteoric rise in early 2021.
Dogecoin Short-Term Outlook
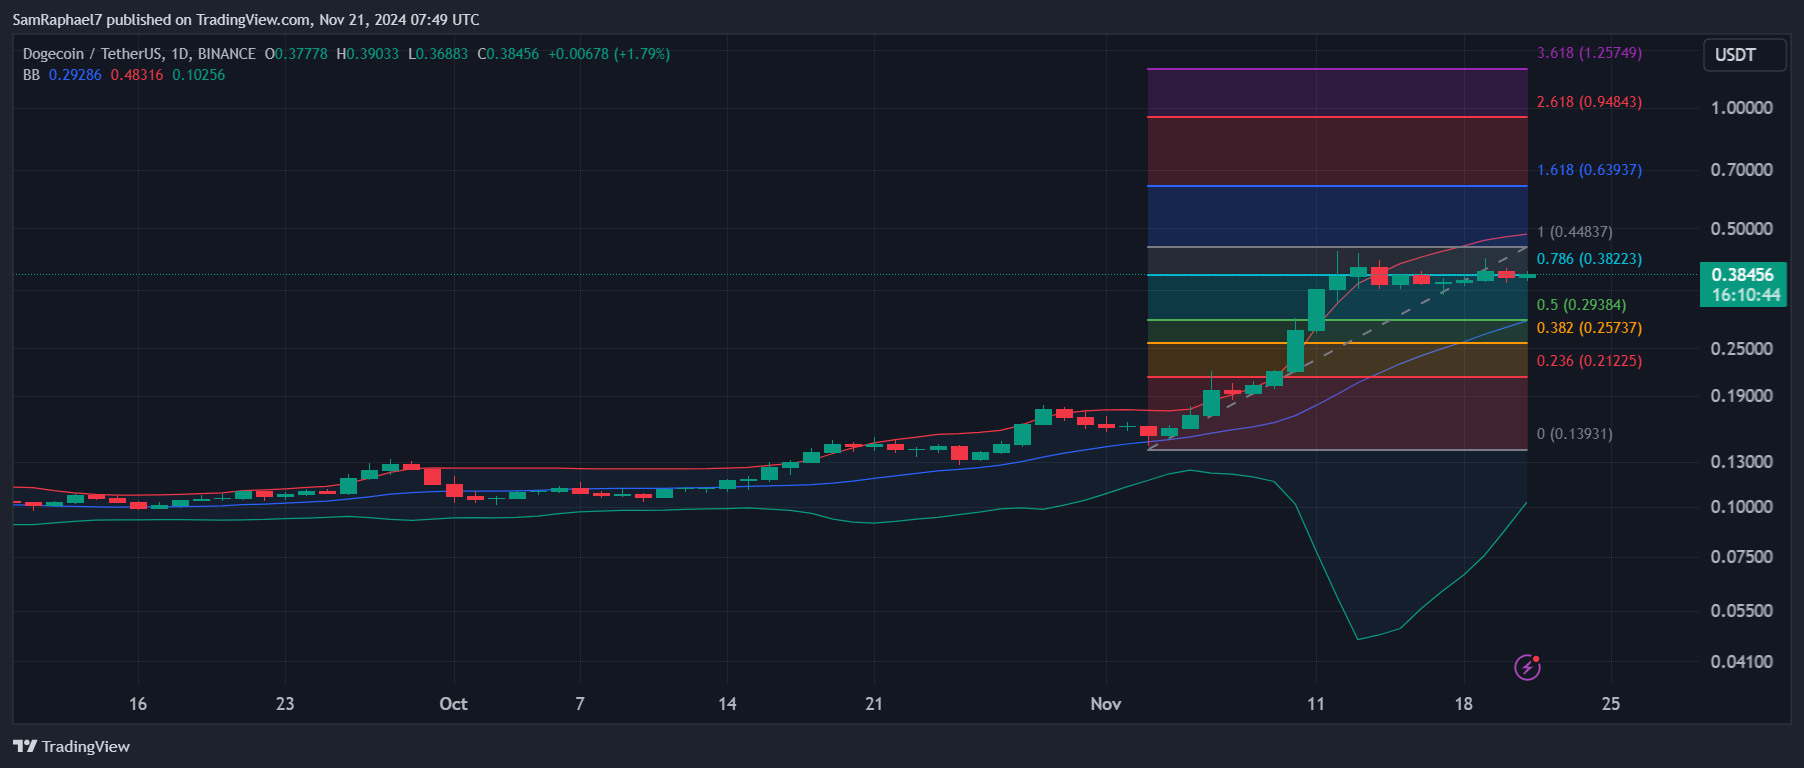
Meanwhile, the daily DOGE chart shows the meme coin’s short-term outlook as it eyes the $1 level. Dogecoin is currently consolidating at nearly $0.39 after its significant rally. Fibonacci retracement levels from the recent low at $0.13 to the local high at $0.44 show support and resistance zones.
The current price is testing the 0.786 Fibonacci retracement level at $0.38, acting as a pivotal short-term resistance. A sustained breakout above this level could propel the price toward $0.44 (the recent high).

Notably, a push above $0.44 could bring Dogecoin face-to-face with the resistance at the upper Bollinger Band ($0.4832). Breaking this level could potentially lead to $0.63, which aligns with the 1.618 Fibonacci extension. DOGE’s last resistance below $1 sits at the Fib. 2.618 level around $0.9484.
However, if a pullback occurs, the 0.618 ($0.29) and 0.5 ($0.25) retracement levels provide strong buying opportunities. The daily Bollinger Bands are also tightening, indicating a breakout could be imminent. This shows market indecision, often preceding massive price movement.
 thecryptobasic.com