Over the past 24 hours, Chainlink (LINK) rallied over 10% to $15.18 as analysts got more optimistic. Predictions for the token are being set at $18.
Chainlink’s market cap as of press time was $9.51 Billion, having increased by 11.4% intraday. The token’s 24-hour trading volume had also risen to $988.81 Million, up 53.56%.
Breakout from Critical Levels
Chainlink just broke out of a long-standing resistance of around $13. Michael Van de Poppe, the founder of MN Trading Ventures, states that this now flipped to a strong support level for this zone, which had acted as a cap for most of 2024.
According to him, this is a crucial breakout because it indicates market sentiment shifting yet again, and possibly towards higher levels.
Poppe points out that a massive flip in $LINK could occur at $13. He predicts an ascent to $18 and expects more momentum from there.
He states that the low on $LINK is in serving a tremendous opportunity. His analysis falls in line with LINK’s current technical setup.
LINK is headed for the $17.83 resistance level and eventually the psychological indicator of $18.
Looking at further insights from experts, Crypto Patel predicts a good move for Chainlink (LINK), which has fallen 90% from its all-time high.
He highlights that it continued rising after forming a bottom around $5. It then hit internal range liquidity (IRL) and bounced back, showing a readiness for a positive move.
As per the analyst, LINK has a chance to hit its all-time high and could be a 280% upside from where it stands today. But a candle close below $8 would nullify this outlook.
Technical Analysis: Will Link Correct?
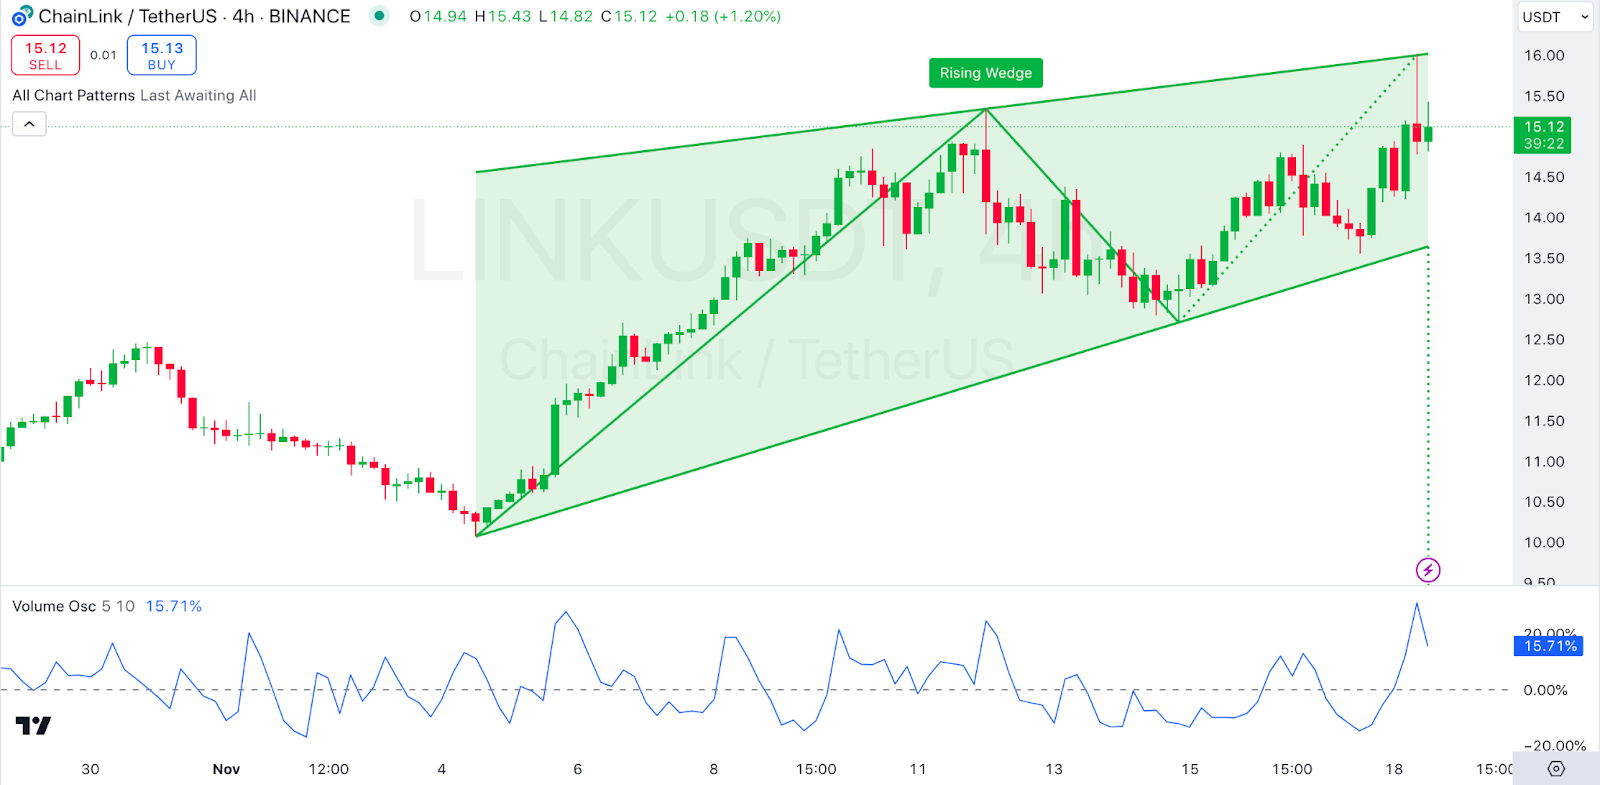
Chainlink’s chart shows a well-defined rising wedge pattern, signaling a period of consolidation coming up after a strong upward move. This could also hint a bearish reversal.
The converging trendlines of the wedge pattern indicate weakness in the bullish momentum toward the apex of the wedge, starting around $13.00.
From there, it proceeds onto this current range of $15.12–$15.50 with higher highs and higher lows. Should the pattern be complete, a fall back to previous support levels won’t be surprising.

Conversely, the chart’s lower portion shows the volume oscillator getting lower, which is usual in a rising wedge.
The volume collapse indicates low buying pressure, creating doubts about the possibility of a continuous bull trend.
The wedge extends to $15.50, at which point immediate resistance lies. A breakout above this level, however, could mean bullish momentum to the next resistance at $17.83.
The next target psychologically would be the level of $18.00 if breached. The key support levels are $14.80 and the lower boundary of the wedge is around $14.50.
If prices break down below here, it could invalidate the current bullish trend, as prices may run back down towards $13.50-13.00.
If LINK is pushed to $14.50 or even lower with heavy volume, it could lead to a retracement to $13.00 or even lower.
 thecoinrepublic.com