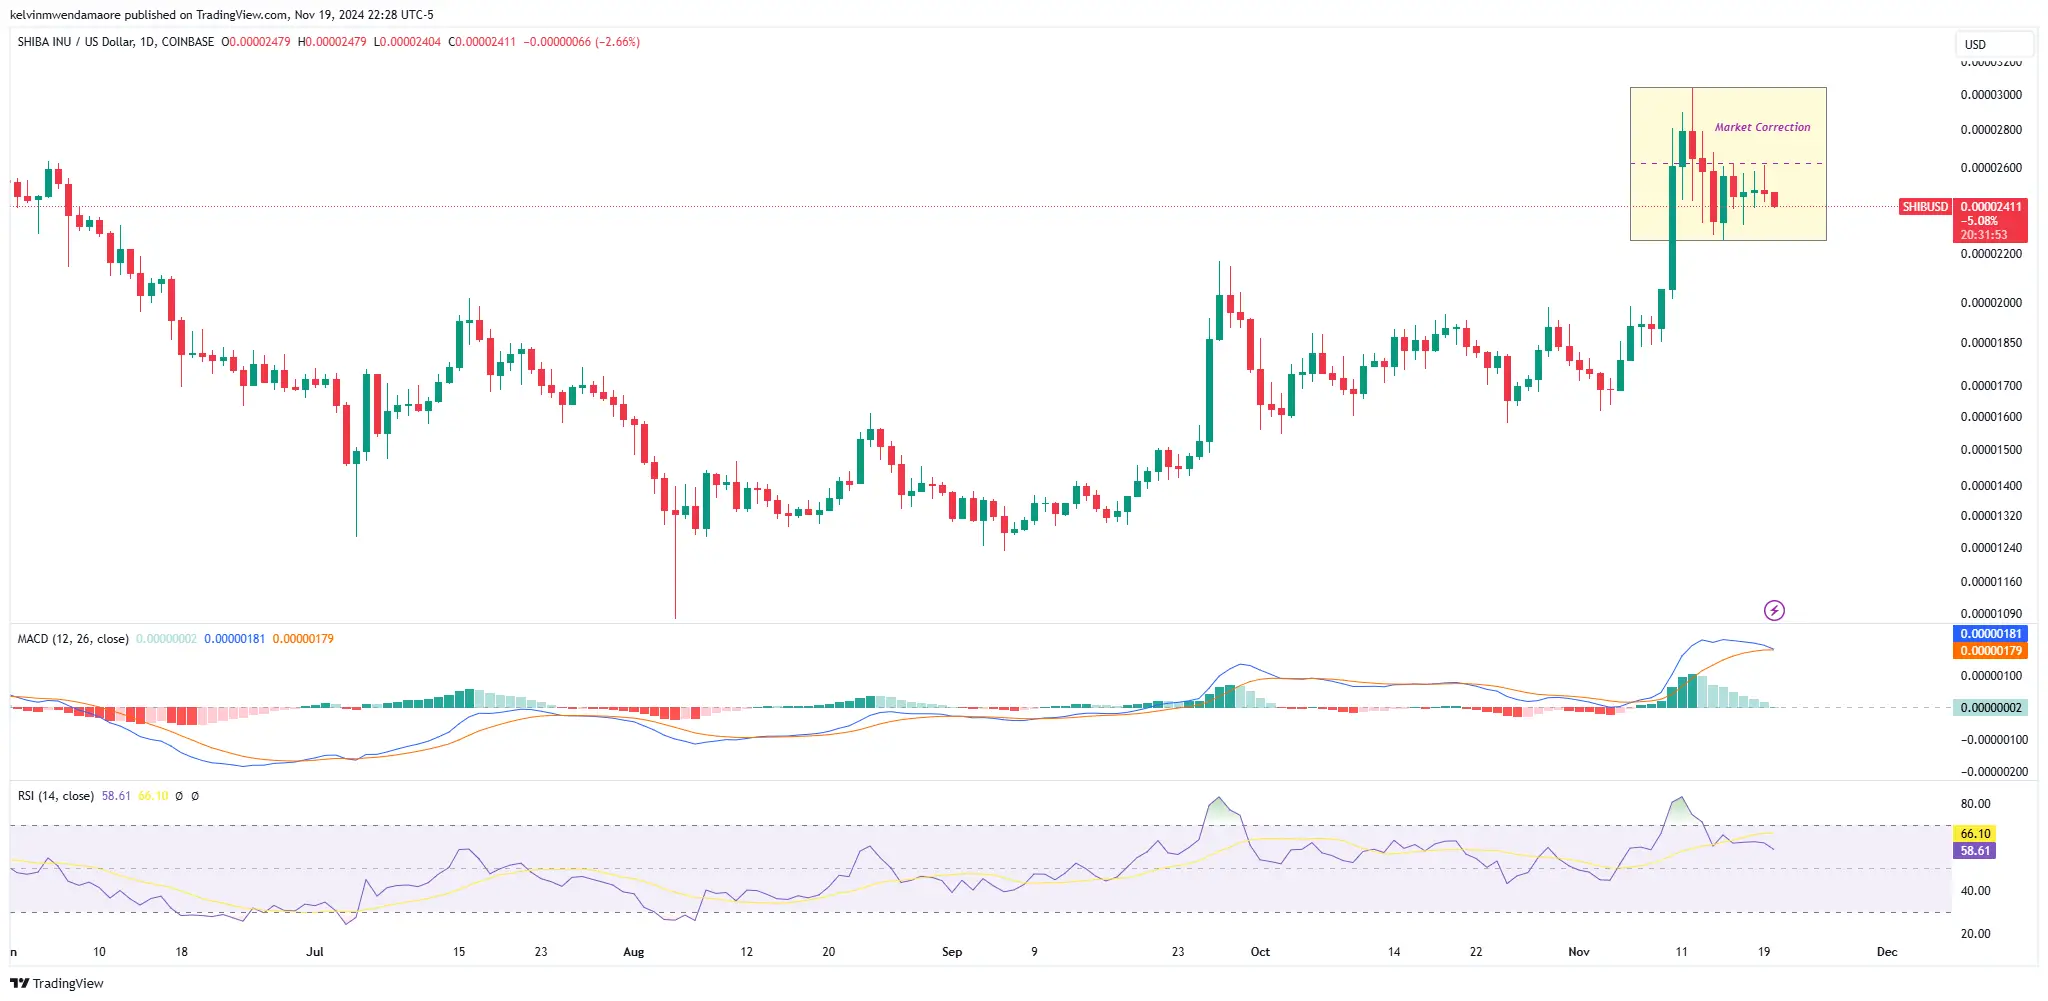
Shiba Inu (SHIB), the popular dog-themed meme coin, exhibits signs of sustained bearish momentum as its price charts reflect a clear downward trajectory, hinting at the potential for further declines. According to TradingView data, the token experienced a strong rally in early November, reaching a local peak of $0.00003 before entering a consolidation phase characterized by lower highs and narrowing price action.
This consolidation, coupled with a declining market cap, suggests a waning bullish momentum that could lead to increased selling pressure. However, a surge in SHIB’s trading volume—up 10% in the past 24 hours—indicates that the cryptocurrency continues attracting attention from traders, even amidst a bearish trend. As the token approaches a critical support level of $0.000023, analysts speculate whether it could breach this zone and dip further to the psychological level of $0.00002.
Technical Indicators Point to SHIB Price Correction
Shiba Inu’s technical indicators provide further evidence of its bearish momentum, suggesting the possibility for continued price corrections. The MACD indicator, for instance, signals a bearish crossover, with the MACD line at 0.00000181 approaching a downward cross below the signal line at 0.00000179. This scenario indicates growing selling pressure and a loss of bullish momentum. The histogram bars also align with the zero line, confirming the bearish outlook.

Advertisement
Similarly, the RSI, currently hovering around 58.61 below the signal line at 66.10, suggests that the cryptocurrency is moving closer to neutral territory after being overbought during its rally. This cooling-off period aligns with the broader consolidation phase in the price chart. While trading volumes remain elevated, providing temporary resilience, the combination of technical signals suggests that sellers may dominate in the short term.

Moreover, SHIB’s liquidation data underscores the strengthening bearish outlook, as more long positions have been liquidated than short ones. According to CoinGlass, $904.89K worth of long positions were liquidated in the past 24 hours, compared to $521.1K in short positions across major exchanges such as OKX, HTX, and CoinEX. This stark imbalance highlights a shift in market sentiment, with traders increasingly betting on the SHIB’s token price continuing to decline.
Can SHIB Dip to $0.00002?
Given these market conditions, the cryptocurrency’s next move largely depends on whether it can hold above critical levels or if bearish momentum drives the price lower. The $0.00002532 level, for instance, serves as the immediate resistance, and any failure to reclaim this level could result in intensified selling pressure. However, if the SHIB token breaks below the 0.236 retracement level at $0.00002424, it may open the door for a drop to the $0.00002259 support zone.
In a bearish scenario, a breach of $0.00002259 would likely set the stage for a test of the psychological $0.00002 level. This zone has historically acted as strong support and could attract buyers looking for a possible reversal. On the flip side, if the SHIB cryptocurrency manages to regain momentum and break through the 0.618 retracement level at $0.00002622, it could indicate renewed bullish sentiment, targeting higher resistance levels like $0.00002856 or even $0.00003044.
 cryptonewsz.com