Crypto market analyst Ali has again highlighted Optimism (OP), an Ethereum scaling layer 2 solution, predicting bullishness on the token.
Ali says OP is capturing a set of chart patterns historically associated with a crack of a potential rally. This is something it experienced in previous cycles.
In his analysis, he zeroes in on OP’s tendency to form bullish ascending triangles at market bottoms. Once confirmed, can be followed up on what are often significant price advances.
#Optimism $OP has a history of forming market bottoms with ascending triangles, often followed by rallies to the 1.618 Fibonacci retracement level. Today, we’re seeing a similar setup, pointing to a bullish target of $7.20 for #OP — a potential 340% gain. pic.twitter.com/4ingaFv4d3
— Ali (@ali_charts) November 11, 2024
According to Ali, OP is now establishing another ascending triangle pattern. It is bound to be preceded by a trend reversal and breakout rally in technical analysis.
Ali believes that OP could surge to a very bullish $7.20 on this basis. This is also at the 1.618 Fibonacci retracement level, the hotspot often seen in technical charting.
If OP can make it that far, that could equal a 340% gain. This would also have the potential to attract traders and investors.
Optimism Down Over 10% for the Day
Although the long-term forecast is bullish, OP has started to go down hard and fast. It shed over 10% in one day. For now, it trades at around $1.59, its price plummeting from its recent highs.
This has hurt market sentiment, and OP’s market cap and trading volume are falling. The current market cap is around $2 billion, and the 24-hour trading volume is around $671.25 million.
The sell off is a broader market correction, but Ali believes the downturn may signal OP’s bottoming process instead of a negative indicator.
Ali points out that forming an ascending triangle often results in these pullbacks as the pattern rallies to near support before breaking out.
In this case, now OP’s price movement around the lower boundary of the triangle could be favorable for a buy, hoping for a rally.
The Case for a Rally: Technical Analysis
Historically, OP technical indicators signal it may be nearing a big price move as the pattern of Fibonacci retracement levels it is following.
OP had previous cycles of breaking out of this setup, and the 1.618 Fibonacci extension needed to be tested after.
Ali’s chart further validates this trend. OP has rallied after consolidating in ascending triangles and heading towards predetermined key Fibonacci resistance levels.
The attached chart shows multiple instances of Optimism being on similar patterns at or around 1.618 Fibonacci.
These historical patterns indicate that Ali’s forecast that OP can hit $7.20 is accurate. After the token formed and broke out of ascending triangles, it has likewise hit these levels.
In technical analysis, the 1.618 Fibonacci extension tends to be a bit of resistance, which makes it a very realistic take-profit target for traders and investors looking for it as a potential profit target.
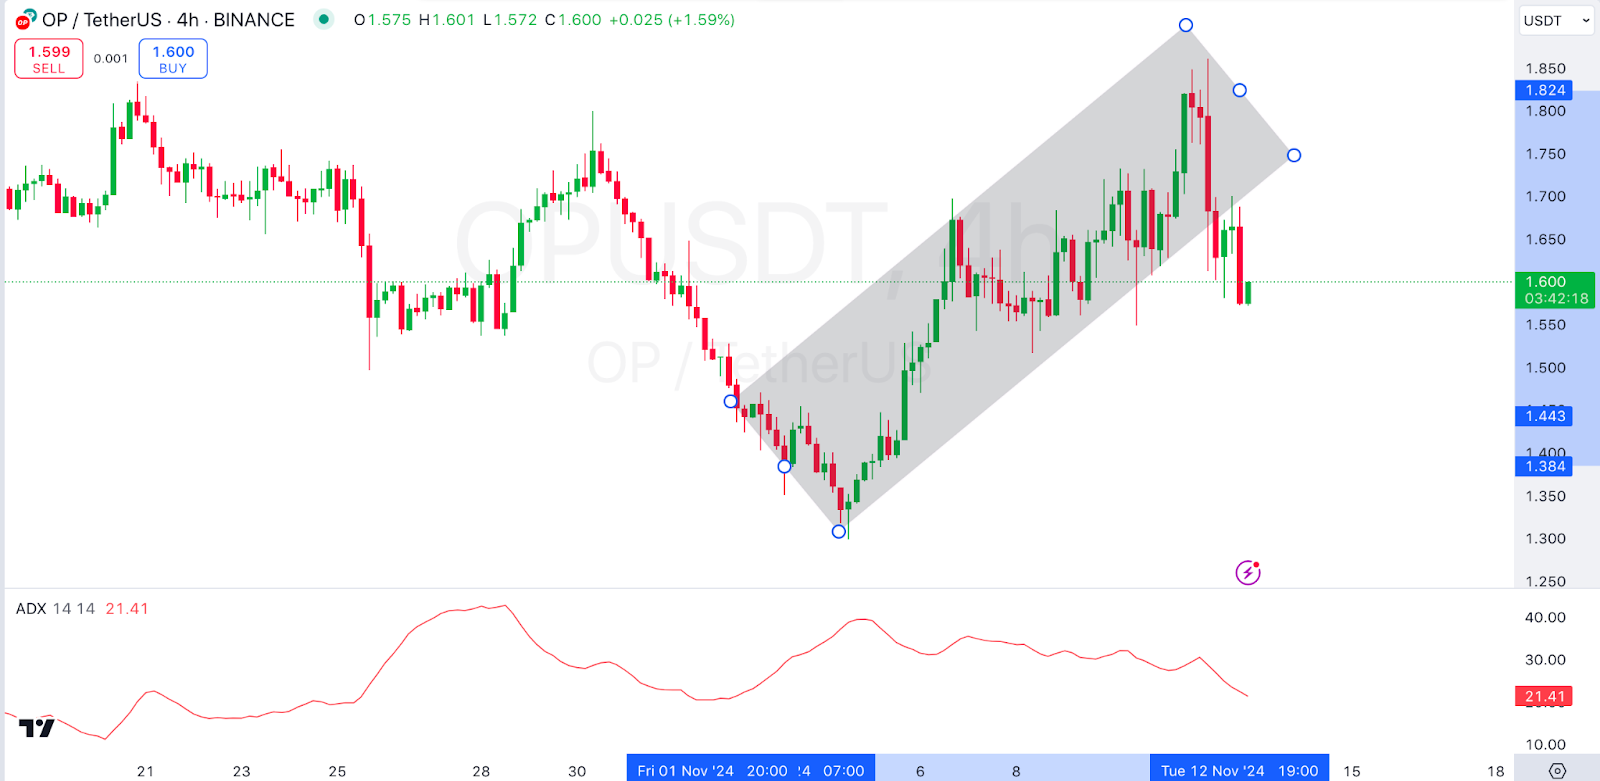
This can be seen from the latest series of red candle stick patterns as the price breaks below the ascending channel.

On the other hand, at 21.41, the ADX reading indicates OP to be in a phase of low trend strength; the asset is consolidating.
If OP breaks out and momentum strengthens, then the ADX will go up, which will mean strengthening momentum, confirming the validity of the ascending triangle and suggesting a strong trend to the upside.
 thecoinrepublic.com
