The bears are in control of today’s session, as seen from the decrease in the global market cap as markets correct from the recent pumps. The total cap stood at $2.89T as of press time, representing a 3.88% increase over the last 24 hours, while the trading volume dropped by 1.4% over the same period to stand at $309.56B as of press time.
Bitcoin Price Review
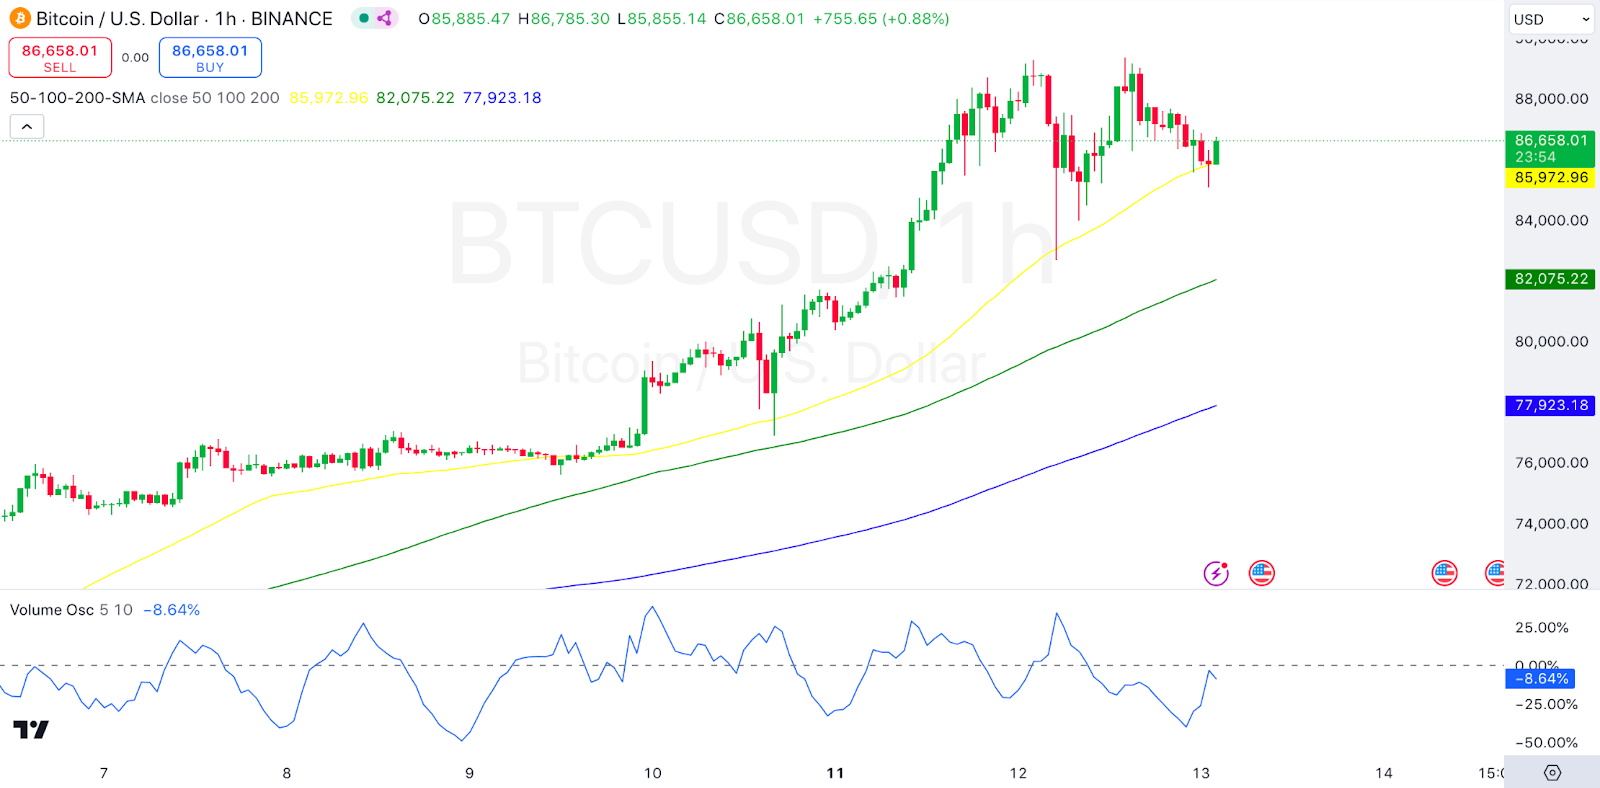
Bitcoin, $BTC, is facing corrections in today’s session, as seen from its price movements. Looking at an in-depth analysis, we see that the chart includes 50, 100, and 200-period Simple Moving Averages (SMAs) on the 1-hour timeframe. BTC is currently trading above the 50 SMA (yellow), indicating short-term bullish momentum. The 100 SMA (green) and 200 SMA (blue) are further below, suggesting overall medium to long-term bullish momentum.
On the other hand, we see that the Volume Oscillator appears to be lower than average, as indicated by a negative percentage (-8.64%). Lower volume in an uptrend could indicate weakening buying pressure. Bitcoin traded at $87,528 as of press time, representing a 2.08% decrease over the last 24 hours.
Ethereum Price Review
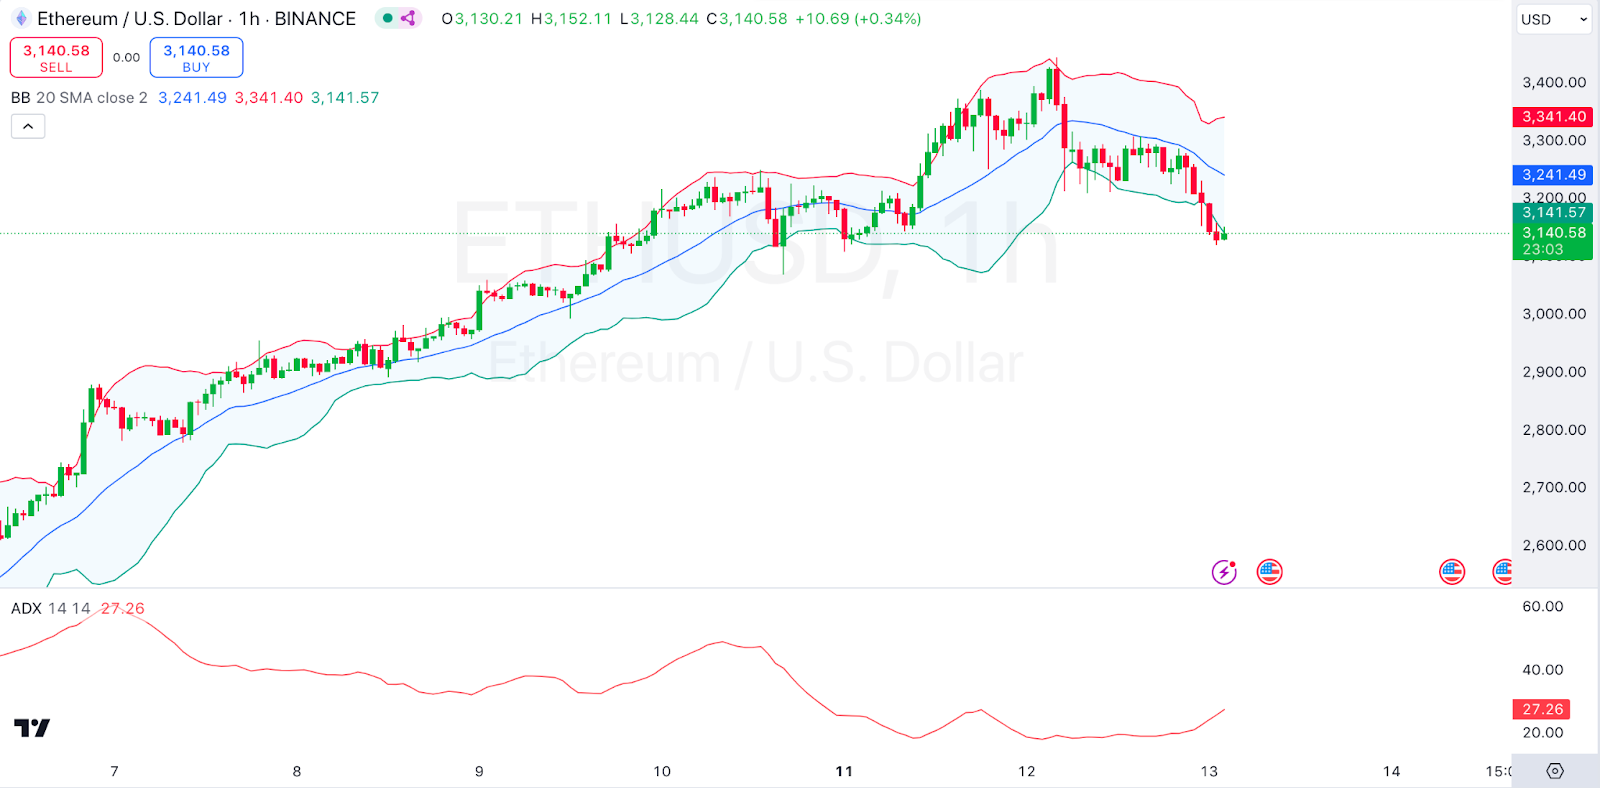
Ethereum, $ETH, is also among those correcting in today’s session as also seen from its price movements. Looking at an in-depth analysis, we see that the chart uses Bollinger Bands with a 20-period SMA, showing volatility and potential overbought/oversold conditions. ETH recently touched the upper band near 3,341, suggesting it was overbought, leading to the recent pullback.
On the other hand, we see that the Average Directional Index (ADX) is at 27.26, indicating a moderately strong trend. However, the ADX line has been trending down, suggesting that the current uptrend may be losing momentum. Ethereum traded at $3,161 as of press time, representing a 6.26% decrease over the last 24 hours.
Peanut the Squirrel Price Review
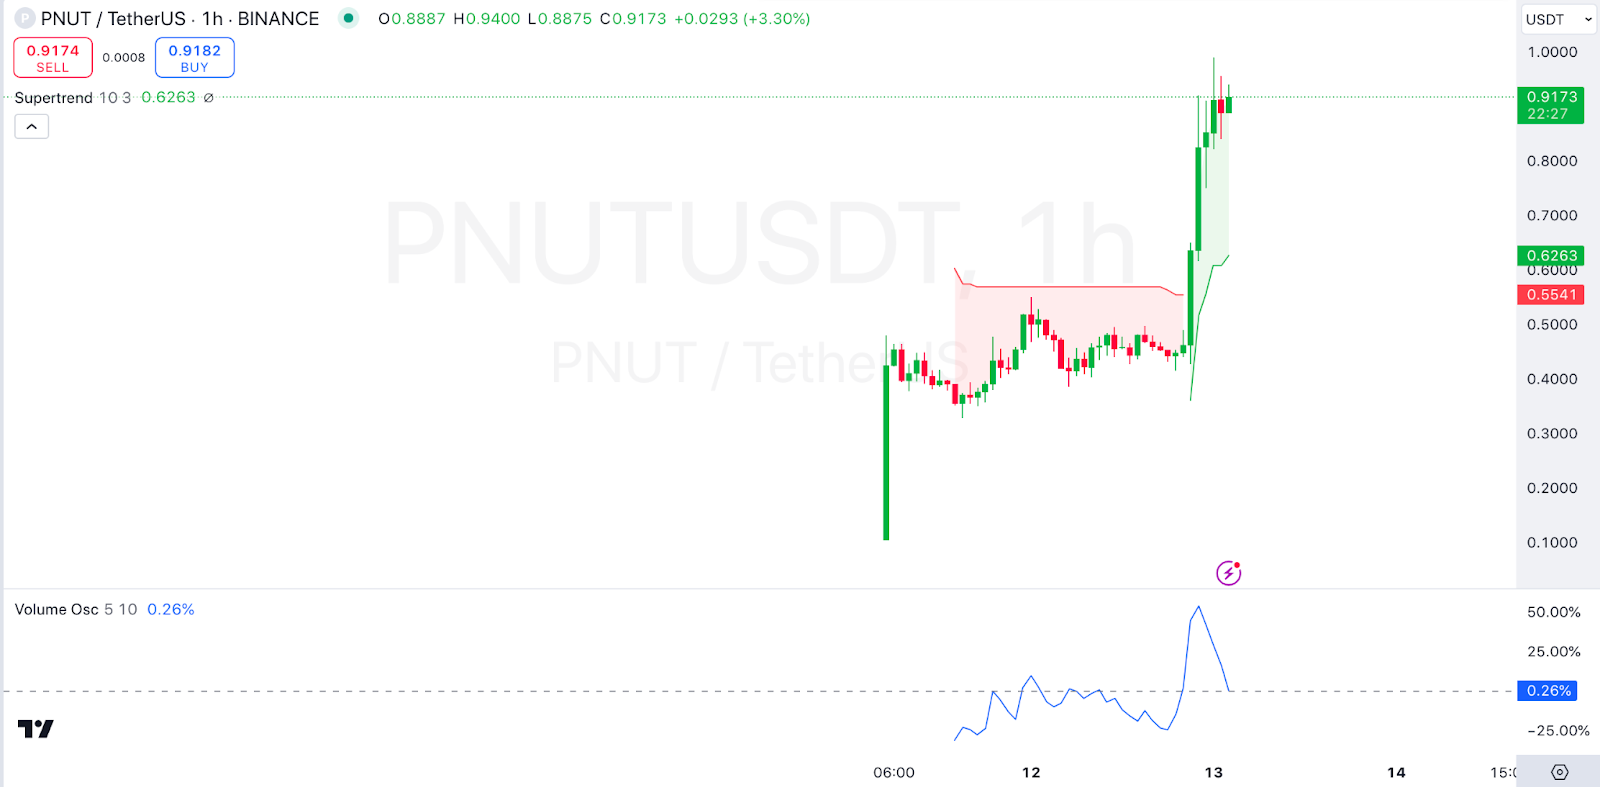
Peanut the Squirrel, $PNUT, is among the gainers in today’s session as also seen from its price movements. Looking at an in-depth analysis, we see that the Supertrend shows a buy signal with a green area on the 1-hour chart, indicating a bullish trend. PNUT has surged significantly, moving above recent resistance levels, showing a strong upward momentum.
On the other hand, we see that the Volume Oscillator is very low at 0.26%, which could suggest that the recent surge lacks strong support from volume. Low volume might lead to a quick reversal if there isn’t sufficient buying interest. Peanut the Squirrel traded at $0.9364 as of press time, representing a 93.27% increase over the last 24 hours.
Ripple Price Review
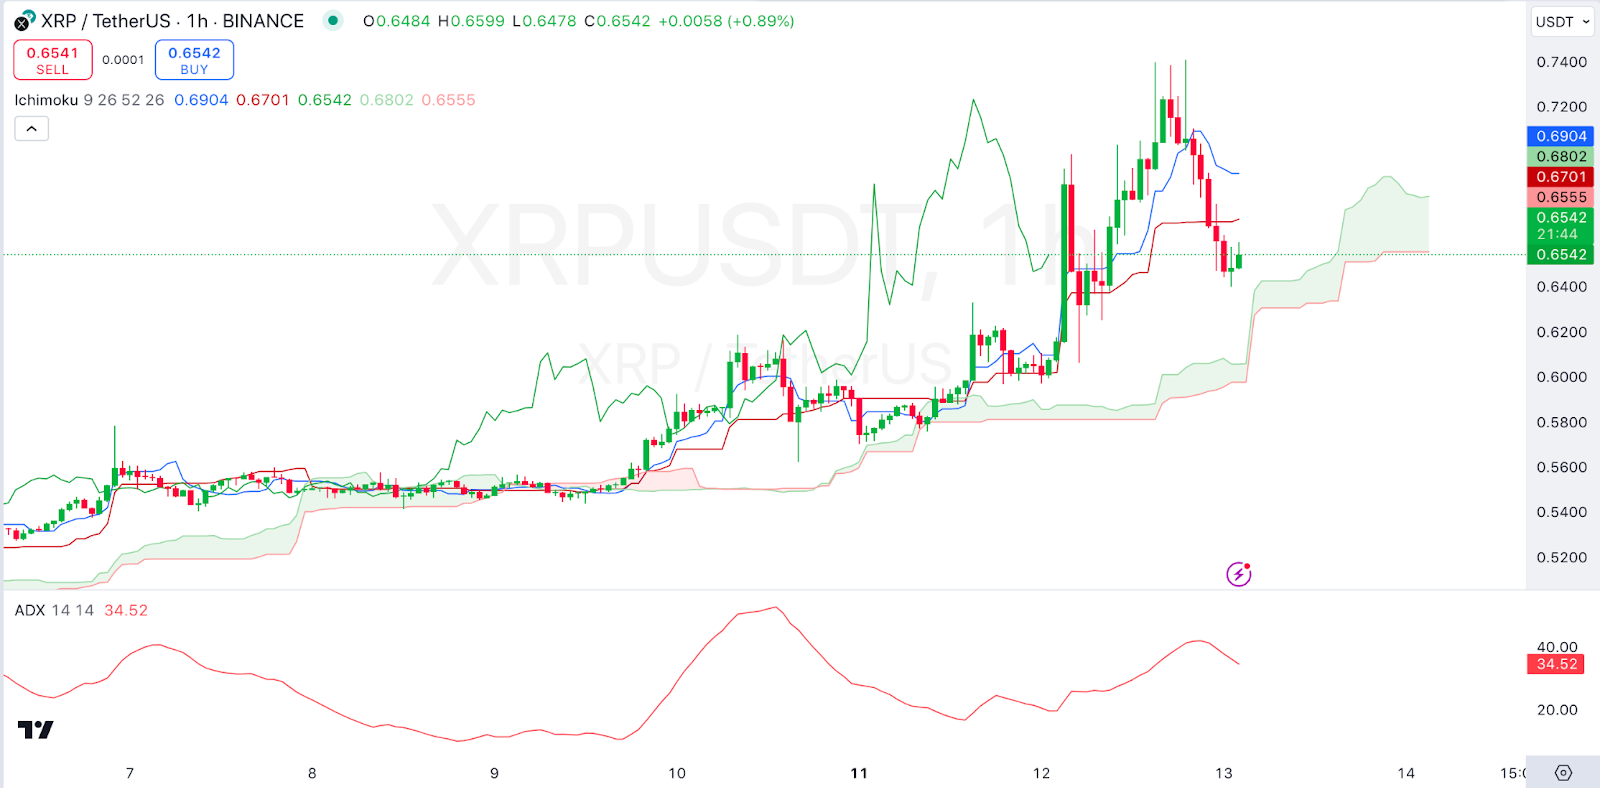
Ripple, $XRP, is also among the gainers in today’s session as seen from its price movements. Looking at an in-depth analysis, we see that the price is trading near the Kumo (cloud), and the green Tenkan-sen line is above the red Kijun-sen line, indicating a potential bullish crossover. However, the recent pullback into the cloud area suggests some indecision and potential consolidation.
On the other hand, we see that the ADX is at 34.52, showing a relatively strong trend. The declining ADX suggests that the trend strength might be weakening. Ripple traded at $0.6586 as of press time, representing a 6.68% increase over the last 24 hours.
Stellar Price Review
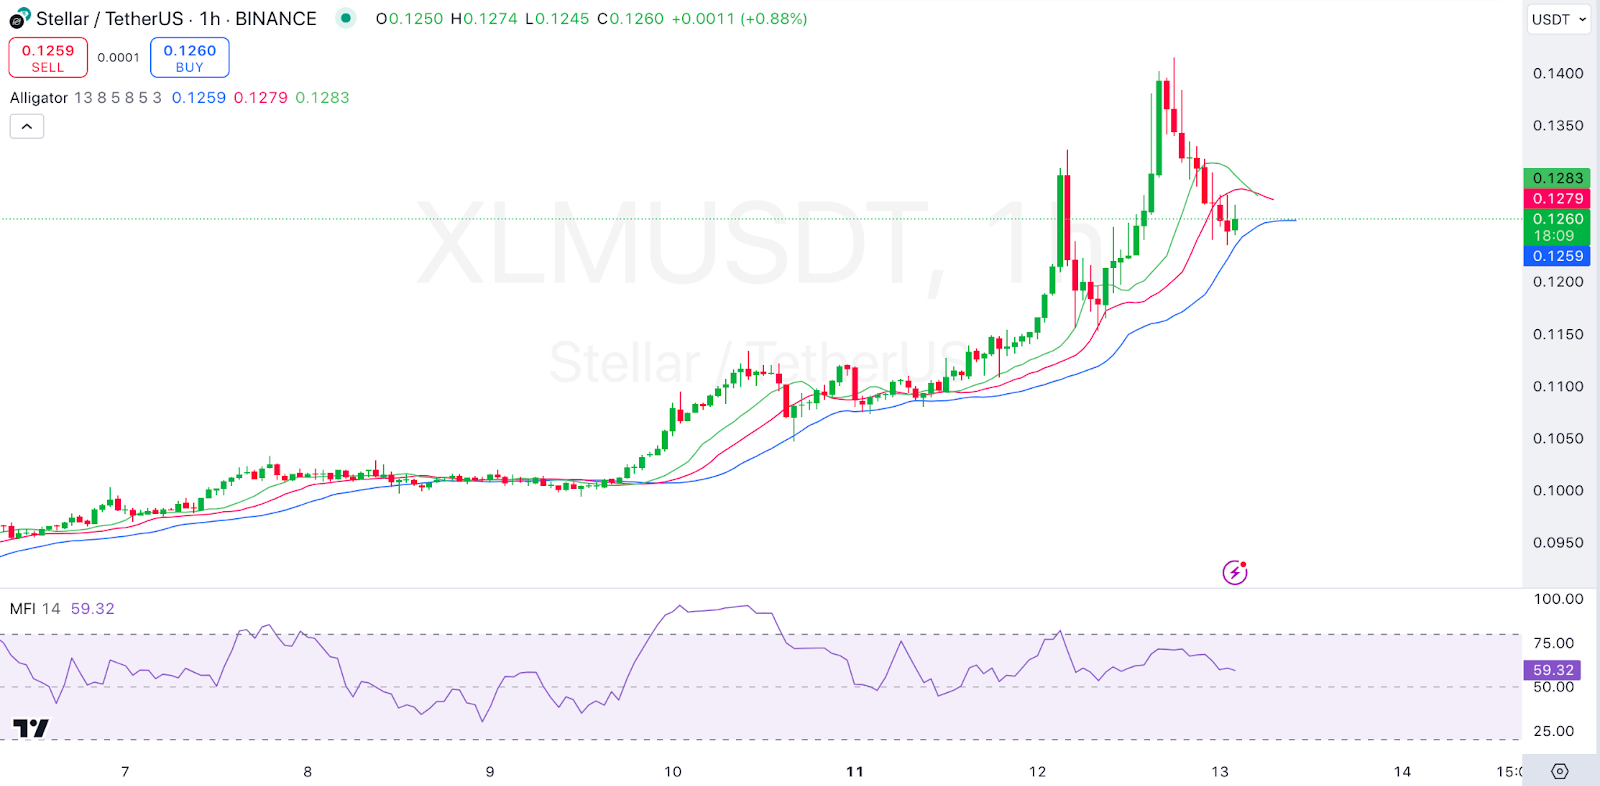
Stellar, $XLM, is also among the gainers in today’s session as also seen from its price movements. Looking at an in-depth analysis, we see that the Alligator lines (jaw, teeth, and lips) are converging after a recent expansion, suggesting a potential slowing in the uptrend and a possible phase of consolidation or reversal.
On the other hand, we see that the Money Flow Index (MFI) is at 59.32, close to the overbought threshold of 80. This level indicates that buying pressure is waning, and a pullback may be on the horizon if the index continues to decline. Stellar traded at $0.1256 as of press time, representing a 3.61% increase over the last 24 hours.
