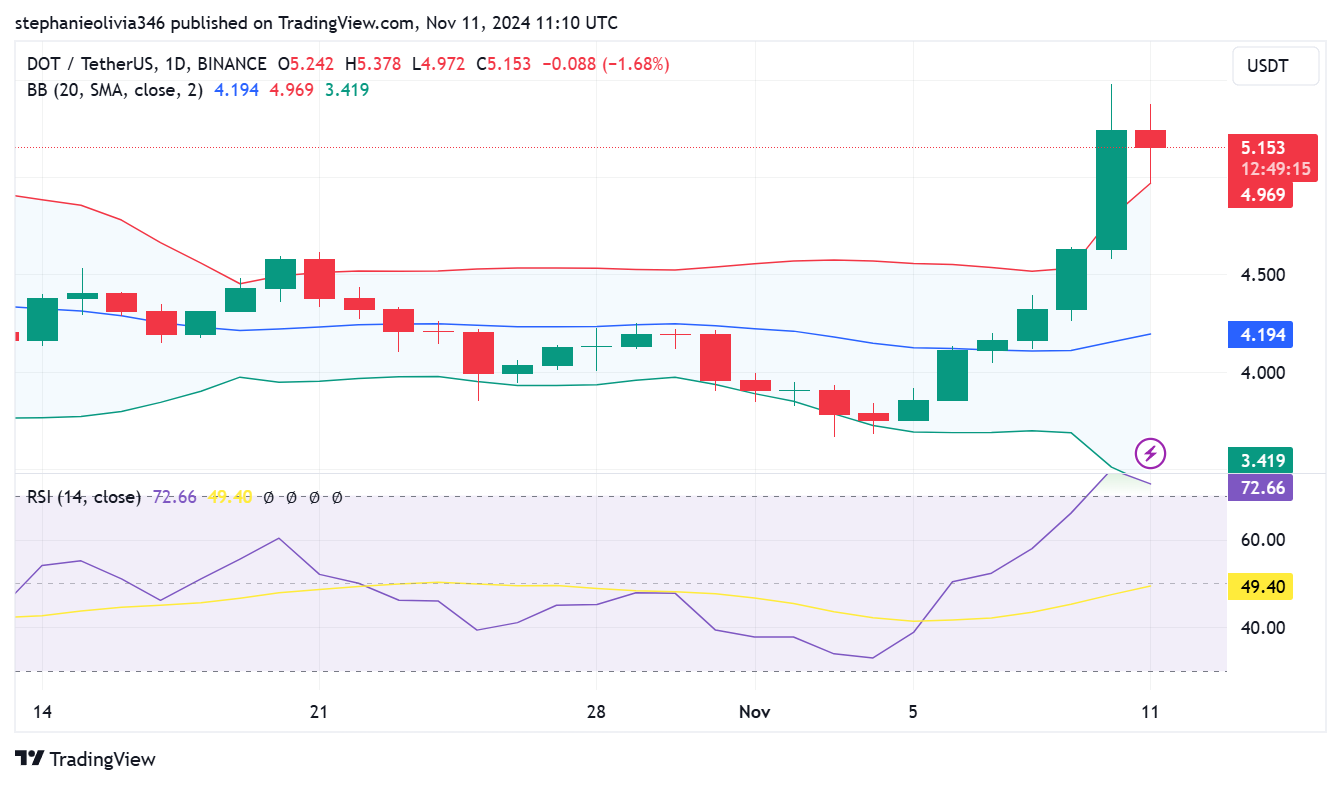
Polkadot (DOT) is currently at $5.15. DOT price has shown a correlation in the last few days climbing through some technical levels.
As the buying pressure rises significantly, technical indicators and analysts show both the possibilities for further growth and levels to monitor for a decline
Insights from analysts like iamflez and i_bot404 suggest major resistance targets ahead. Even though overbought conditions and profit-taking could influence short-term moves.
DOT Surges Above Key Levels, Testing Resistance
In Polkadot’s daily chart, there is a breakout above the upper Bollinger Band, which is now slightly above $4.97.
This move above the band indicates a shift from bearish ground to bullish territory. However, breaking the upper Bollinger Band indicates that DOT may be overbought. Market correction or consolidations. is more likely to occur.
When the Bollinger Bands expand, it indicates that the market is more volatile in the middle of a new trend.
Immediate support is located around $4.97 at the upper Bollinger Bands. The second upward resistance level is the middle Bollinger Bands’ line at $4.19.
However, if DOT is to move further up and cross $5.50, the next possible level maybe $7.575. The analyst iamflez considers this to be a key resistance level.
Overbought RSI Indicates Caution Amid Buying Pressure
The Relative Strength Index is now at 72.66 which is considered overbought.

An RSI above 70 means that the asset is in an overbought state, it is likely to retrace as profit takers come in.
However, in strong uptrends, the assets could stay overbought for a long time, which makes a continuation of the trend possible if the buying pressure is sustained.
Another analyst, i_bot404, views $3.60 as a mega-support in that if the price pullback to this point it will be safe.
1- $DOT highly undervalued but great project. Mega support around $3.6, and nearest mega resistance is $16.2. It is basically 3x-4x capability, low risk investment. Hasn't pumped yet pic.twitter.com/hq7Bt0OwmE
— Block_Diversity v.8 ™️ (@i_bot404) November 10, 2024
The analyst believes that DOT is undervalued and has longer-term growth prospects; therefore, it makes sense to target $16.20 and get 3-4x returns from the current levels.
However, overbought conditions could delay further gains, especially if the asset encounters resistance at the $5.50 level in the near term.
Overbought conditions could pull back to bring further upside, especially if the asset encounters a resistance level in the short term.
Analysts Weigh in on Long-Term Potential
With growing interest in Polkadot, many analysts have set long-term targets for the asset, assuming certain conditions hold.
next level of resistance looks to be ~$7.575
— Flez (@iamflez) November 10, 2024
if $DOT passes this price we off to the moon 🚀 pic.twitter.com/mDUtMNT4cY
Having further analyzed $7.575 as the level that must be breached to create further buying pressure, analyst iamflez predicts more surges for DOT.
One X user added that holding above the 200-day EMA could fuel a rally to $11, reflecting optimism about DOT’s technical setup.
The recent surge in DOT’s price aligns with these targets, suggesting that bullish sentiment may support additional gains if the asset holds its current levels. However, failure to maintain these levels could result in consolidation, allowing traders to assess long-term support at $4.19 and lower.
 thecoinrepublic.com
