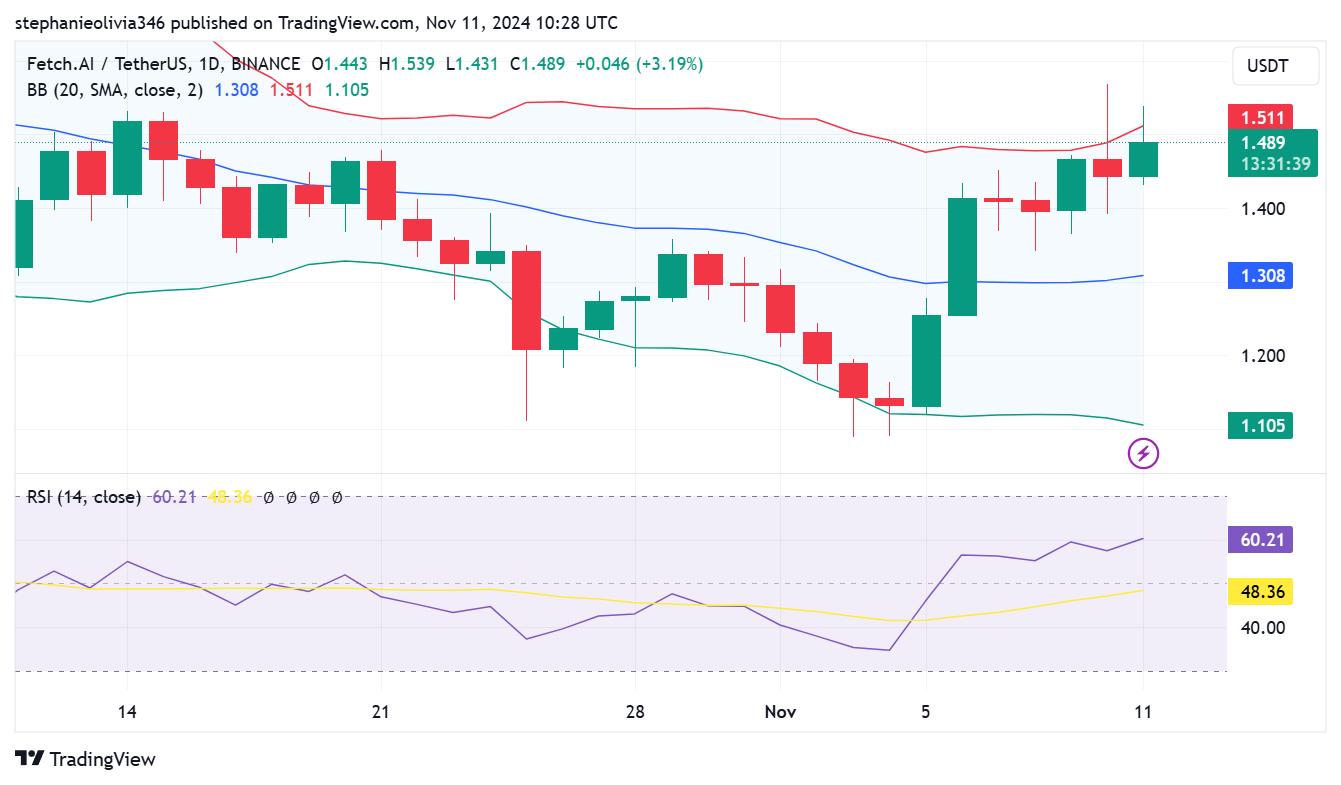
Fetch.AI (FET) is steadily soaring with a new bullish movement that recently attracted the interest of traders and analysts. The price is near key resistance levels and any breakout will likely lead to a further increase in the price.
Targets and levels of support according to analyst CryptoLeo00 reveal that a reversal of the trend is expected soon.
Fetch.AI Rising Momentum and Key Indicators
The daily chart for Fetch.AI is quite bullish, with the price fairly close to the upper Bollinger Band at $1.51. However, this means that there is upward pressure on its buying price. This is because FET has risen from the lower and upper bands within a short period.

Bollinger Band’s continuous widening signifies increased volatility, a situation that usually precedes a new trend, likely in the upper direction.
In addition, the Relative Strength Index (RSI) is at 60.21. It’s not far from the overbought level above 70, indicating a lot of the buying pressure coming from the market.
This opens a possibility for even higher price movement. However, the trader should be careful as the RSI is approaching the 70 mark which is considered as overbought. Traders are watching the $1.51 resistance closely, with the middle Bollinger Band around $1.31 acting as immediate support if a pullback occurs.
Analyst’s View: Potential Breakout and High Targets
CryptoLeo00, the analyst, reportedly stated that Fetch.AI is ready for a major pump. Especially if it crosses a long-term descending trendline. Formerly regaining the $1.5 mark, the next significant level of focus is $1.739, which is a horizontal resistance level.
$FET is back above $1.5, pushing toward a breakout of this massive trendline.
— L E O (@CryptoLeo00) November 10, 2024
The key level to watch now is $1.739—once we break above it, we’ll start forming a new higher high on the weekly chart.
You’re not ready for what’s coming. ✍️🏻 pic.twitter.com/fGdK1r3rxt
A break above the $1.739 mark would signify the trendline breakout and potentially establish a new higher high on the weekly chart and shift sentiment to bullish.
Based on CryptoLeo00, it is expected that the asset will hit $3.516, a 234.71% increase from the current price if sustained. This target is derived based on a measured move from the current consolidation pattern which is an indication a parabolic rally can be achieved.
Furthermore, intermediate resistances might be faced. A break above $1.739 could set Fetch.AI on a strong upward path.
Support Levels and Bullish Channel
If Fetch.AI’s price fails to cross $1.739, it has strong support at $1.5 which is at the lower part of its range. Furthermore, a dip below $1.5 will get support near $1.2, which had been the base for previous rallies.
These support areas are quite important for sustaining the bullish structure in the event that FET experiences short-term reversal or range-bound action.
The chart also demonstrates the possible formation of an ascending channel with both supporting and resistance lines on the upside.
If FET continues to follow this channel, the formation of a series of higher lows is likely, which will further solidify the overall bullish trend in order to reach the target price of $3.516.
However, traders should pay close attention to the channel boundary and support level to control risk.
 thecoinrepublic.com
