The bulls are in control of today’s session, as seen from the increase in the global market cap. The total cap stood at $2.29T as of press time, representing a 2.14% increase over the last 24 hours, while the trading volume jumped by 20% over the same period to stand at $85.73B as of press time.
Bitcoin Price Review
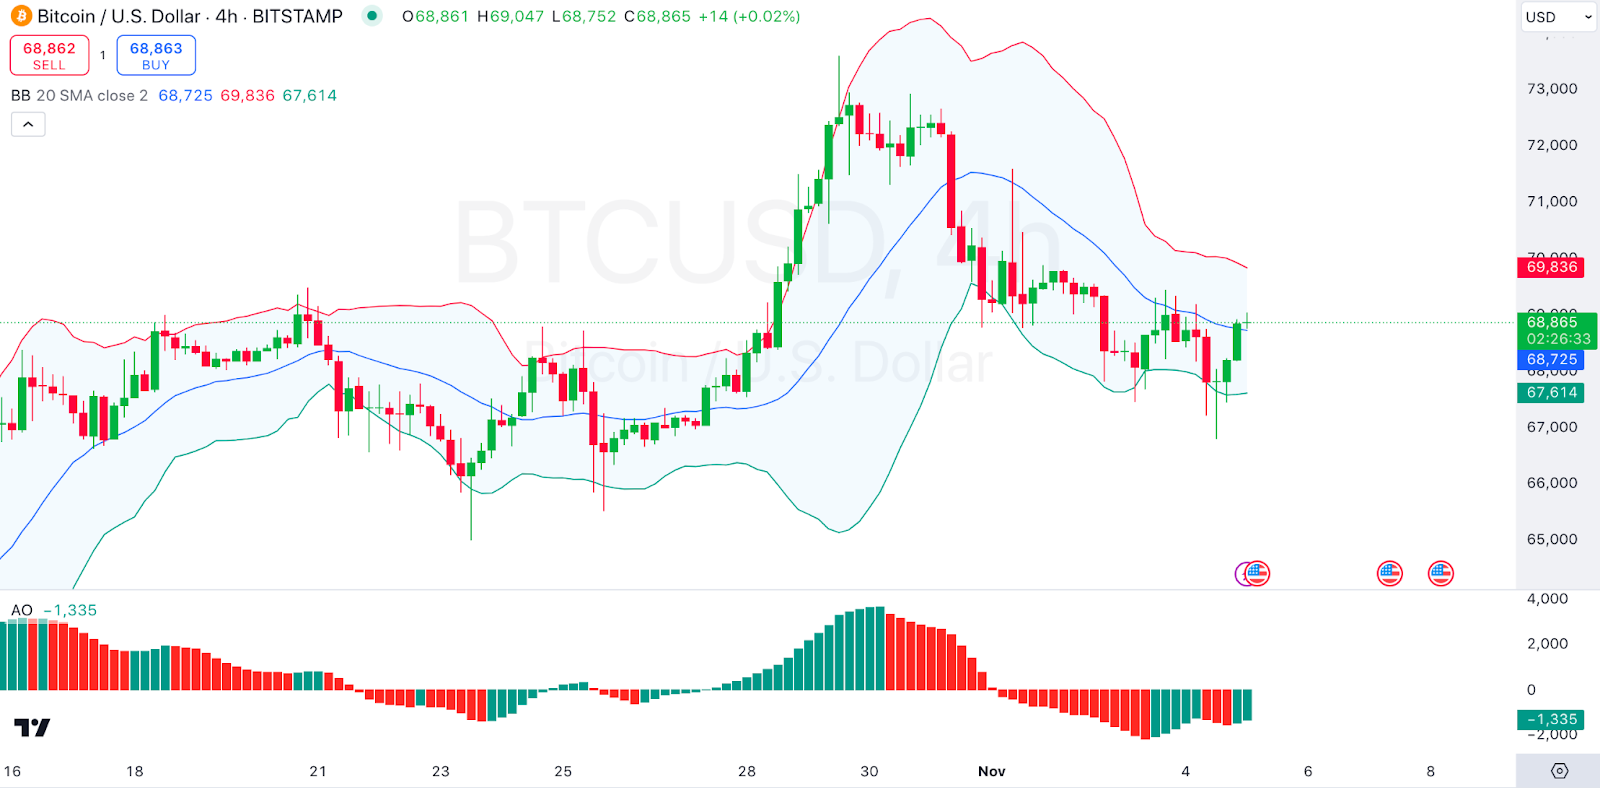
Bitcoin, $BTC, has posted gains in today’s session, as seen from its price movements. Looking at an in-depth analysis, we see that the BTC price is trading near the middle band of the Bollinger Bands, which suggests a neutral stance. The recent upward movement indicates a potential bullish reversal as BTC moves away from the lower Bollinger Band.
The Awesome Oscillator shows a bullish momentum as the green bars increase. This could indicate a possible continuation of the bullish trend if the price breaks the middle band resistance. Bitcoin traded at $68,785 as of press time, representing a 0.36% increase over the last 24 hours.
Ethereum Price Review
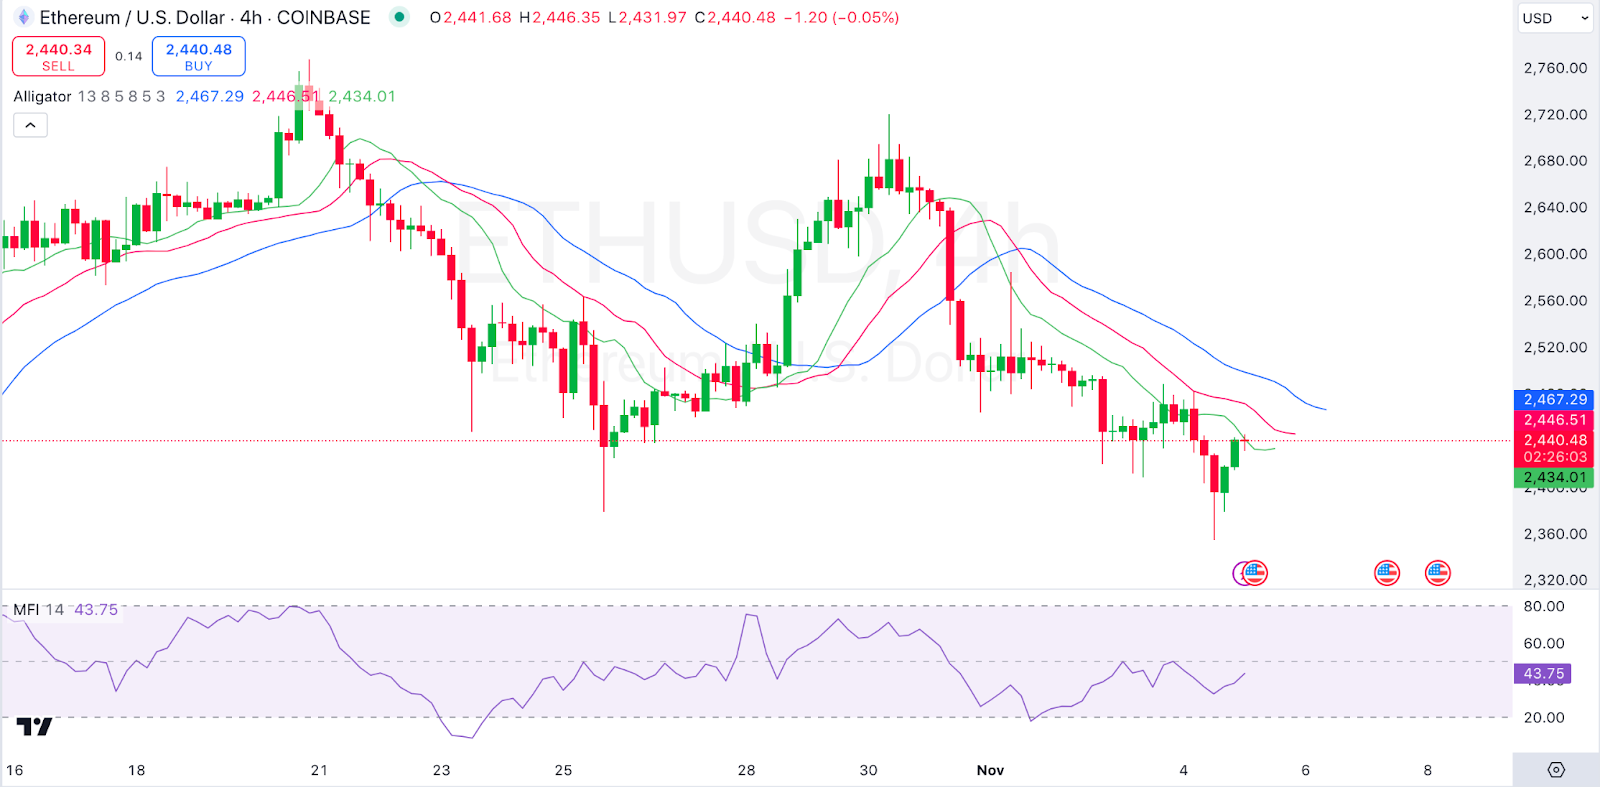
Ethereum, $ETH, has failed to post gains in today’s session, as seen from its price movements. Looking at an in-depth analysis, we see that ETH has been in a downtrend, with the Alligator lines in a bearish alignment (green below red and blue). This indicates a strong bearish trend, though recent candles show consolidation around support.
The Money Flow Index (MFI) is at 43.75, indicating a neutral stance. If it moves above 50, buying pressure might return; otherwise, ETH could remain under bearish control. Ethereum traded at $2,436 as of press time, representing a 0.56% decrease over the last 24 hours.
MOG Coin Price Review
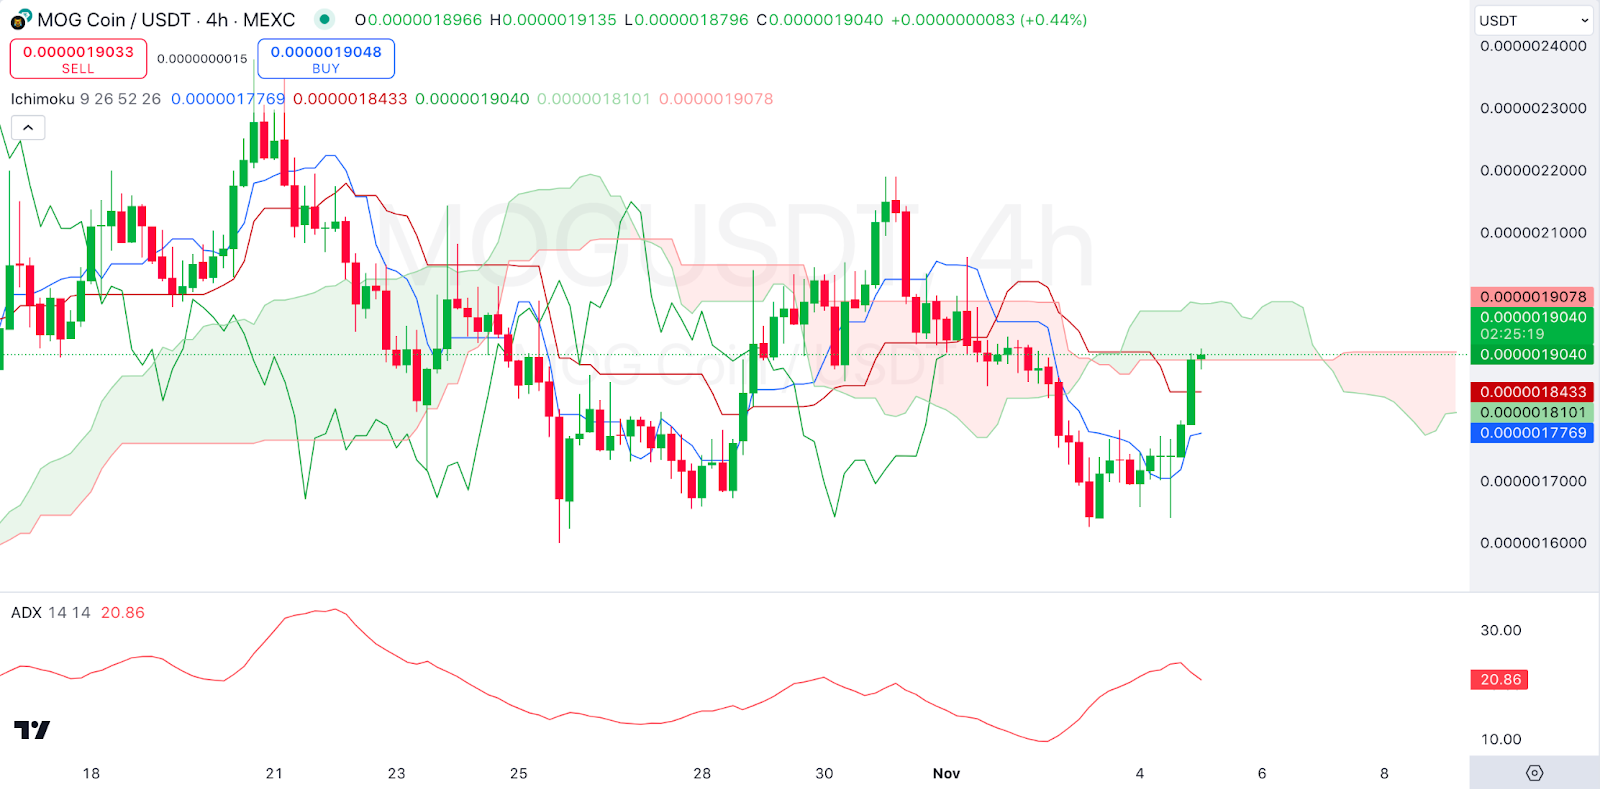
MOG Coin, $MOG, is also among the gainers in today’s session as also seen from its price movements. Looking at an in-depth analysis, we see that MOG is attempting to break out above the Ichimoku Cloud, which may indicate a bullish reversal. The price breaking above the cloud would confirm this trend shift.
On the other hand, the ADX is at 20.86, suggesting a weak trend strength. This may imply the current movement lacks strong momentum. MOG Coin traded at $0.051916 as of press time, representing a 14.46% increase over the last 24 hours.
Dogecoin Price Review
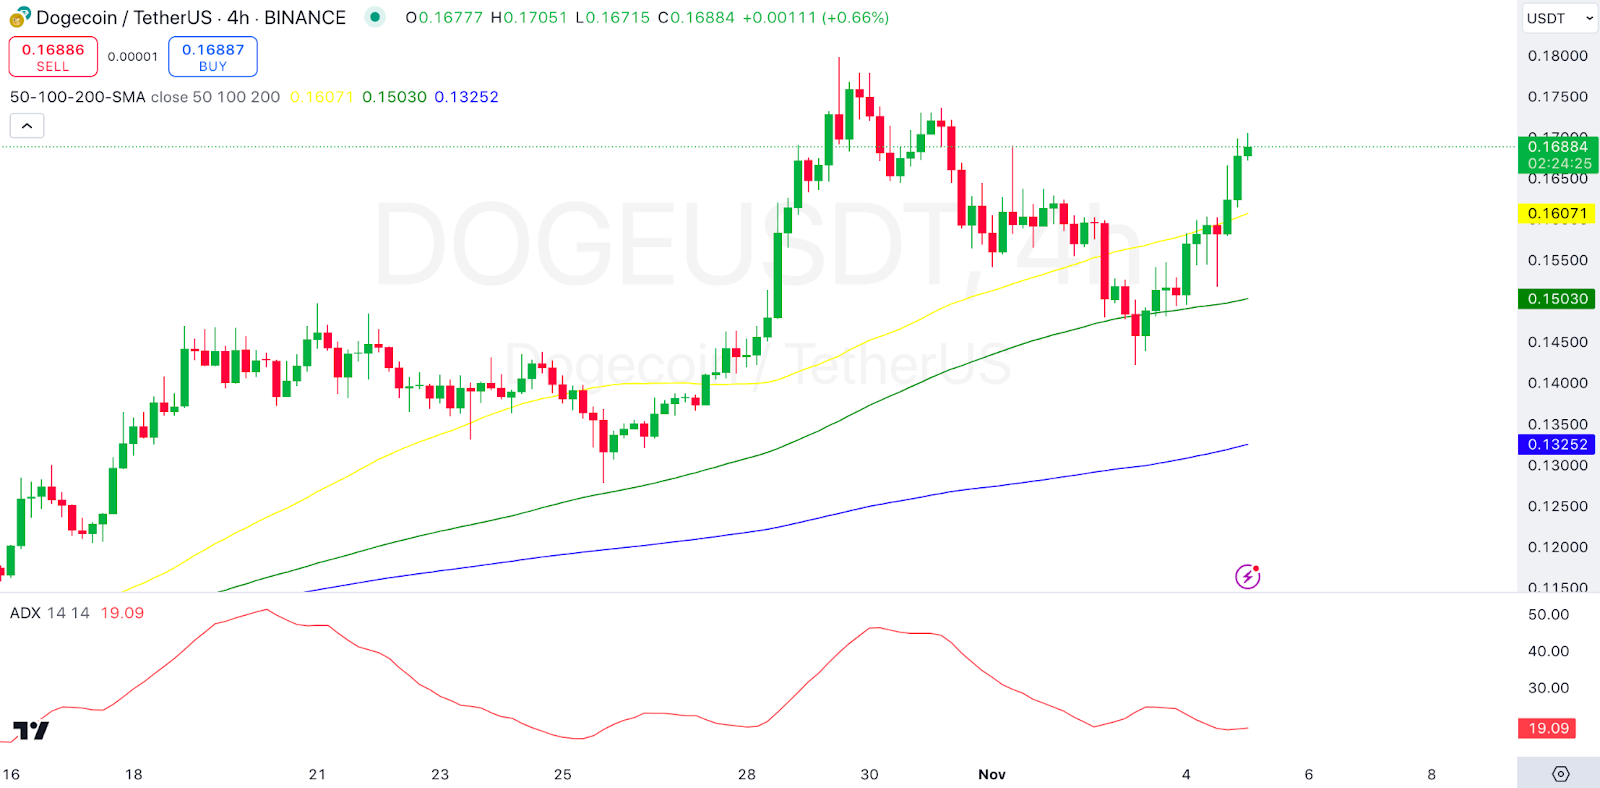
Dogecoin, $DOGE, is also among the gainers in today’s session as also seen from its price movements. Looking at an in-depth analysis, we see that DOGE shows bullish momentum as it trades above the 50-day SMA, and all three moving averages show alignment for a bullish crossover.
On the other hand, we see that the ADX at 19.09 reflects a weak trend. A rise in ADX would indicate strengthening momentum. Dogecoin traded at $0.1685 as of press time, representing a 10.9% increase over the last 24 hours.
Shiba Inu Price Review
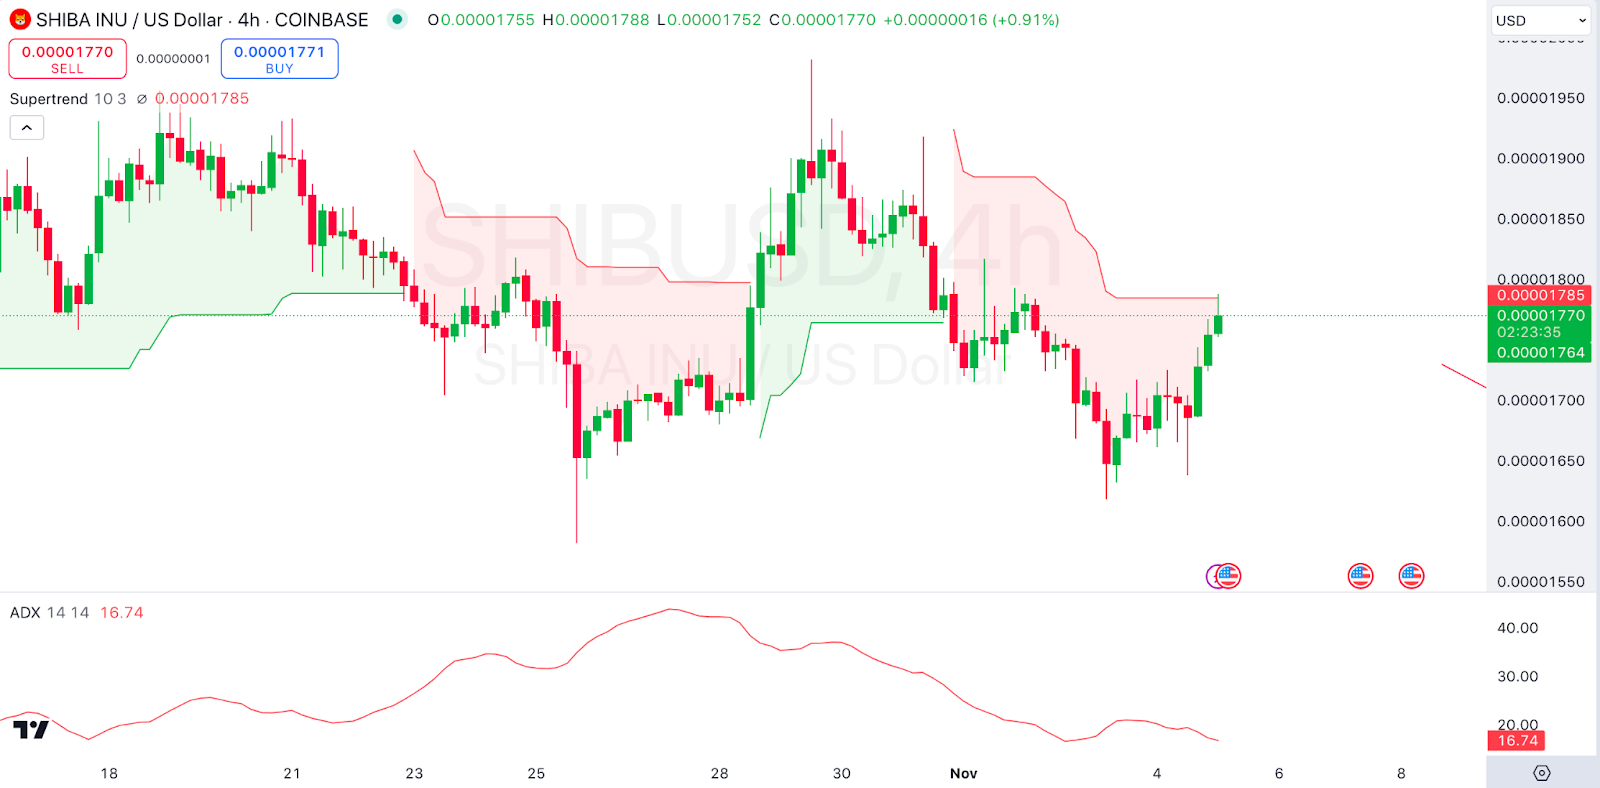
Shiba Inu, $SHIB, is also among the gainers in today’s session as also seen from its price movements. Looking at an in-depth analysis, we see that the Supertrend indicator shows a bullish signal with SHIB trading above the green line, suggesting a potential upward movement.
On the other hand, we see that the ADX at 16.74, the trend strength is weak, which may mean limited momentum in either direction unless there is a breakout. Shiba Inu traded at $0.00001763 as of press time, representing a 5.42% increase over the last 24 hours.
