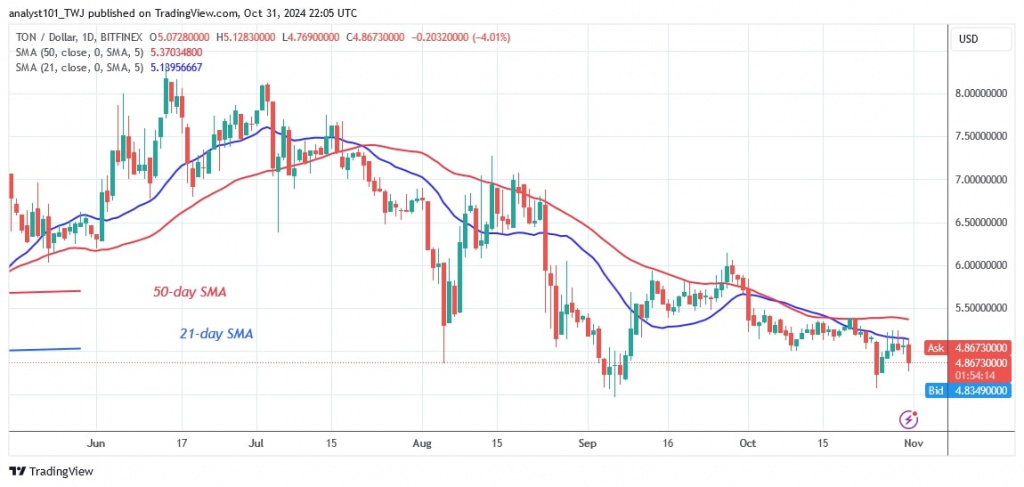
The price of Toncoin (TON) has fallen above the $4.50 support level since September 4 and has fluctuated between $4.50 and $6.00.
TON price long-term forecast: ranging
TON has been trading below the moving average lines since October 1, as reported by Coinidol.com. The rising prices were slowed down by the moving average lines. The presence of doji candlesticks also caused a steady price movement. The TON price fell and has now recovered to $4.57, its current support level. The uptrend was halted by the 21-day SMA. Now TON is trading within a narrow range between the support at $4.50 and the 21-day SMA below the resistance.
TON indicator
The price bars are below the descending moving averages. The lines of the moving averages act as resistance for the price bars. Doji candlesticks dominate the price action and slow the rise above the $4.50 support level. This symbolizes traders who are uncertain about the direction of the market.
Technical Indicators
Resistance Levels: $6.00, $8.00, $10.00
Support Levels: $5.00, $3.00, $1.00

What is the next move for Toncoin?
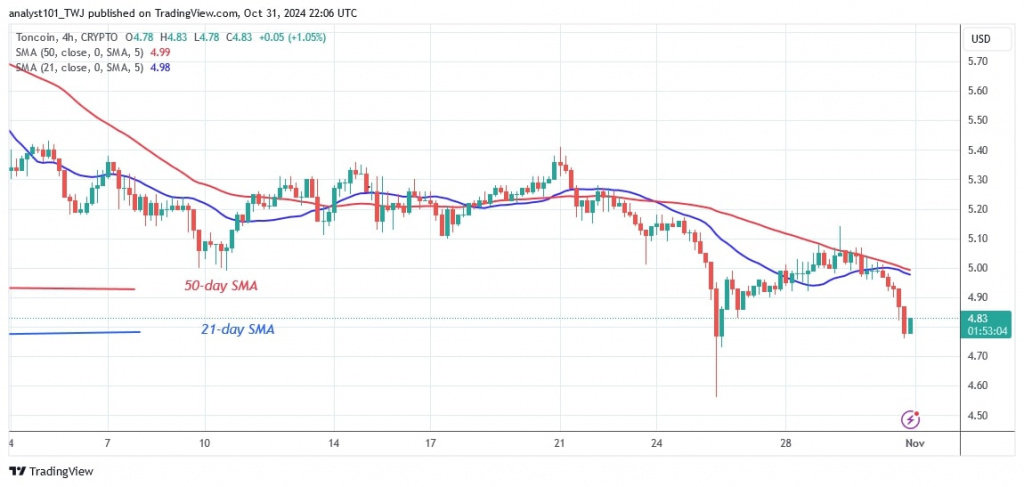
TON is in a sideways movement above the $4.70 support on the 4-hour chart. Although the altcoin is trading below the moving average lines, it is above the current support level at $4.70.
TON rises to retest the moving average lines. TON rises to retest the moving average lines. Bears lose control of the resistance level when they break above the moving average lines. A rejection reaction would show that the bears are in charge. TON will either continue to move sideways or retrace.

Disclaimer. This analysis and forecast are the personal opinions of the author. They are not a recommendation to buy or sell cryptocurrency and should not be viewed as an endorsement by CoinIdol.com. Readers should do their research before investing in funds.
 coinidol.com
