- Bitcoin Cash price analysis is bearish today.
- Support for BCH/USD is present at $354.
- Resistance is present at $384.
The Bitcoin Cash price analysis shows the coin crashed hard as the price decreased to a one-year lowest level today. BCH has been on a downtrend since 10th November after reaching a second peak on 9th November at $717. BCH continues downside since then, losing significant value over this time, amounting to nearly 50 percent. The price has reached down to $359 today as a result of the continuous bearish trend. The next support for BCH is present at $354, which may also be tested soon.
BCH/USD 1-day price chart: BCH to revisit $6354 support
The 1-day price chart for Bitcoin Cash price analysis shows the coin was showing a bearish tendency since 10th November, but the bearish pressure further ignited today as the price has come down a yearly low and is now trading at $359.67 at the time of writing. BCH/USD reports a loss of 5.04 percent over the last 24 hours and reports a loss in value amounting to 18.14 percent over the past week. On the contrary, the trading volume has increased by 3.10 percent today, but the market cap has decreased by 5.16 percent.
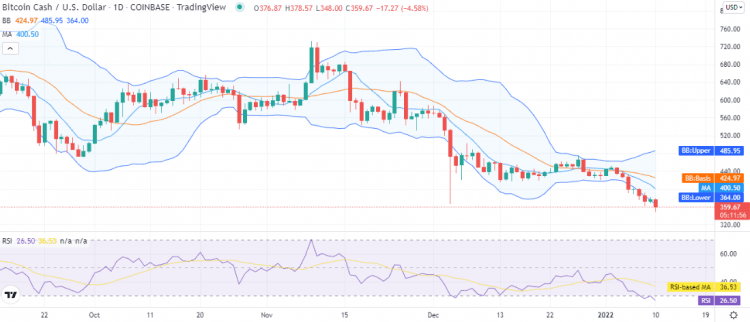
The volatility was low previously for BCH/USD but started to increase from 4th January as the Bollinger bands are diverging since then, but today as the price crashed to years low, the volatility increased further. Currently, the price is trading below the lower limit of the indicator, which at the $364 mark now represents resistance for BCH. The moving average (MA) has also started to travel downwards and s trading at $400.
The relative strength index (RSI) has also been traveling downwards and has entered the undersold zone. The RSI is trading on a downwards slope at index 26 as the selling pressure is high from the bearish side.
Bitcoin Cash price analysis: Recent developments and further technical indications
The 4-hour price chart for Bitcoin Cash price analysis shows the coin got support at $357, as the price took an upturn from this point rejecting further downside. The price has been elevated up to $359. The increase is comparatively very small, but the last green candlestick is hopeful for assuming the price is maintaining its level now.
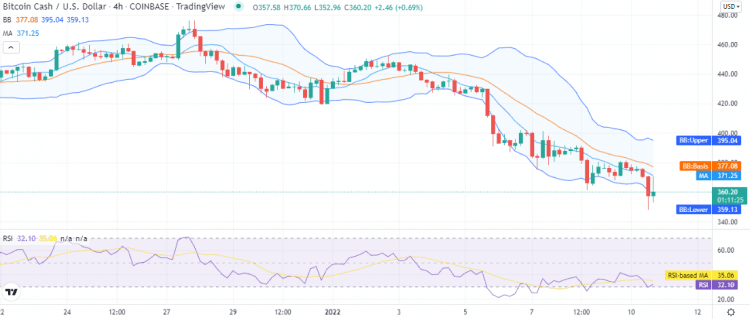
The volatility is high on the 4-hour chart as well. The lower limit of the Bollinger bands at the $359 mark now represents support for BCH price. The RSI curve has also turned upwards due to the recently found bullish support after touching the border of the oversold region today. However, the RSI is still trading low at index 32.
Bitcoin Cash price analysis conclusion
The Bitcoin Cash price analysis shows the price is present at the lowest level of the year. But as we know, the entire market has been trembled down today, and BCH also followed the trend. The hopeful sign is the present support that just appeared, but we assume the persistence of the support will define BCH’s next move.
Disclaimer. The information provided is not trading advice. Cryptopolitan.com holds no liability for any investments made based on the information provided on this page. We strongly recommend independent research and/or consultation with a qualified professional before making any investment decisions.