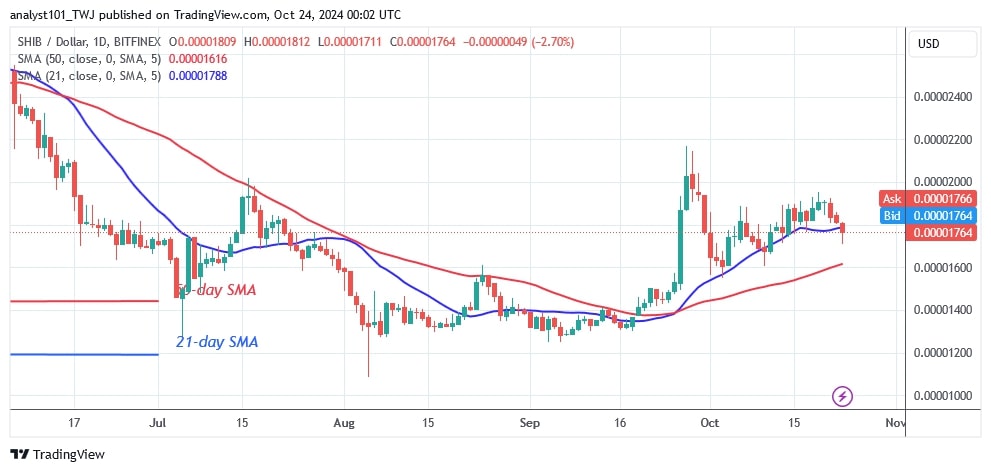
The price of Shiba Inu (SHIB) has fallen further above the moving average lines. The bulls and bears are trying to hold above the 21-day moving average as the cryptocurrency continues to lose ground.
Long-term forecast for the Shiba Inu price: bullish
On the downside, the bears have pushed the altcoin below the 21-day SMA. SHIB is above the 50-day SMA support but below the 21-day SMA resistance. It fell between the moving average lines and hit a low of $0.00001711 before recovering. The altcoin is expected to continue its decline to a low above the 50-day SMA or the $0.00001600 support.
However, if the buyers sustain the price above the 21-day SMA, the altcoin will resume its uptrend. SHIB/USD will reach its all-time highs of $0.00002000 and $0.00002100. The altcoin is currently worth $0.00001792 at the time of writing this article.
SHIB indicator analysis
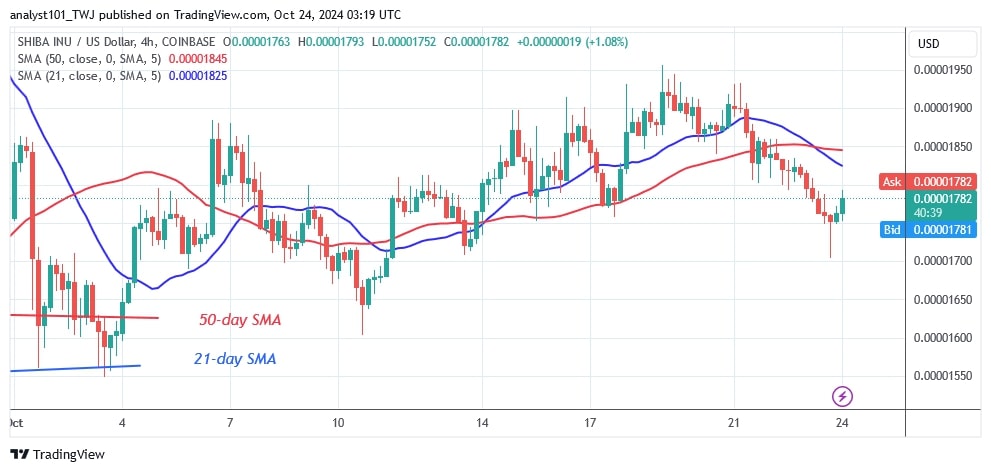
SHIB has fallen below the 21-day SMA support. The price bars are located between the moving average lines, which causes the cryptocurrency to move in a range between the moving average lines. On the 4-hour chart, the price bars are below the moving average lines, indicating that the previous trend has ended.
Technical indicators
Key Resistance levels: $0.00001200, $0.00001300, $0.00001400
Key Support levels: $0.00000600, $0.00000550, $0.00000450

What is the next move for Shiba Inu?
The altcoin is forced to trade between the moving average lines on the 4-hour chart in a range-bound pattern. Buyers have failed to sustain the price above the 21-day moving average line. The altcoin is trading above the 50-day SMA support but below the 21-day SMA resistance. SHIB will change if the moving average lines are broken.
On the 4-hour chart, the altcoin is correcting upwards as it recovers its bullish momentum.

Disclaimer. This analysis and forecast are the personal opinions of the author. They are not a recommendation to buy or sell cryptocurrency and should not be viewed as an endorsement by CoinIdol.com. Readers should do their research before investing in funds.
 coinidol.com